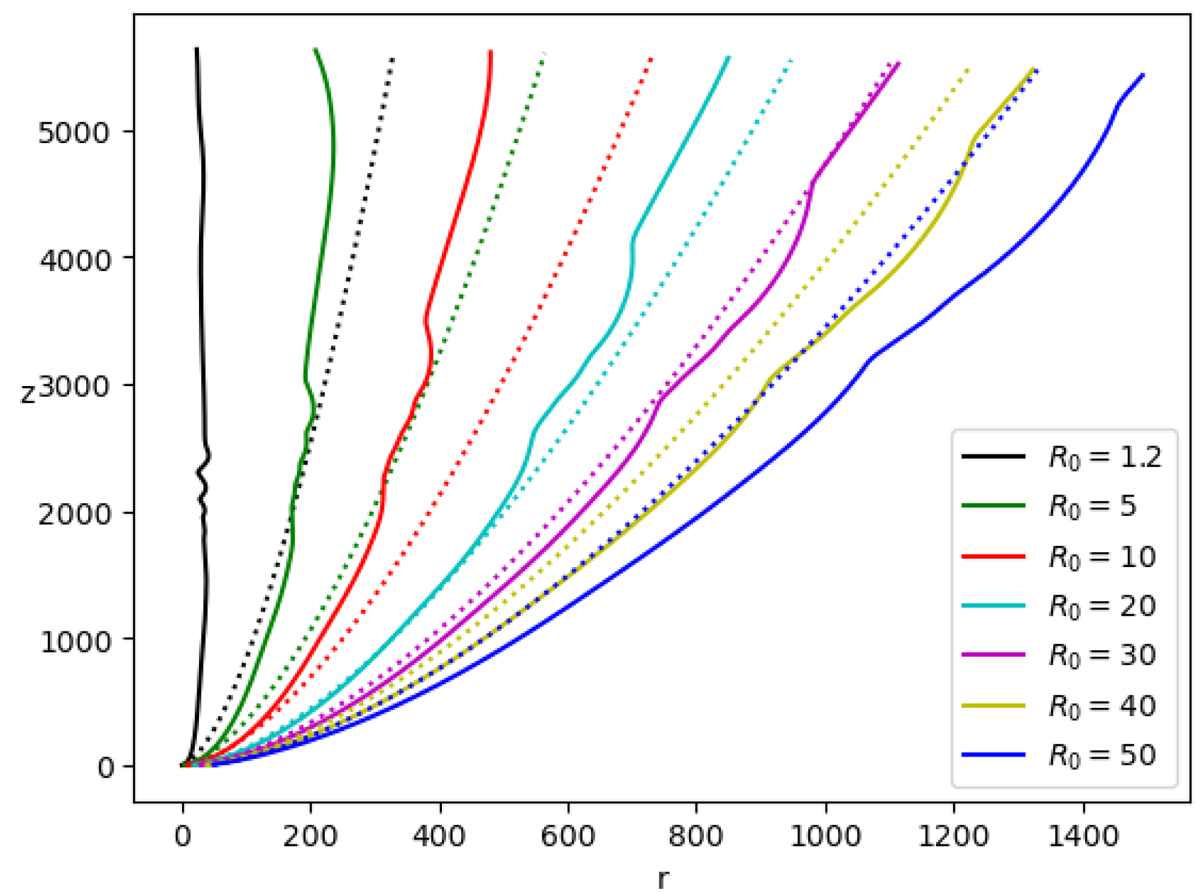
Fig. 8.
Download original image
Evolution of several magnetic field lines during the simulation computation, for different anchoring radii R0 and for the reference simulation K2. The field lines at the first output of the simulation (initial conditions) are shown in dotted lines. The field lines at the last output of the simulation (final state) are shown as full lines.
Current usage metrics show cumulative count of Article Views (full-text article views including HTML views, PDF and ePub downloads, according to the available data) and Abstracts Views on Vision4Press platform.
Data correspond to usage on the plateform after 2015. The current usage metrics is available 48-96 hours after online publication and is updated daily on week days.
Initial download of the metrics may take a while.