Open Access
Fig. C.1.
Download original image
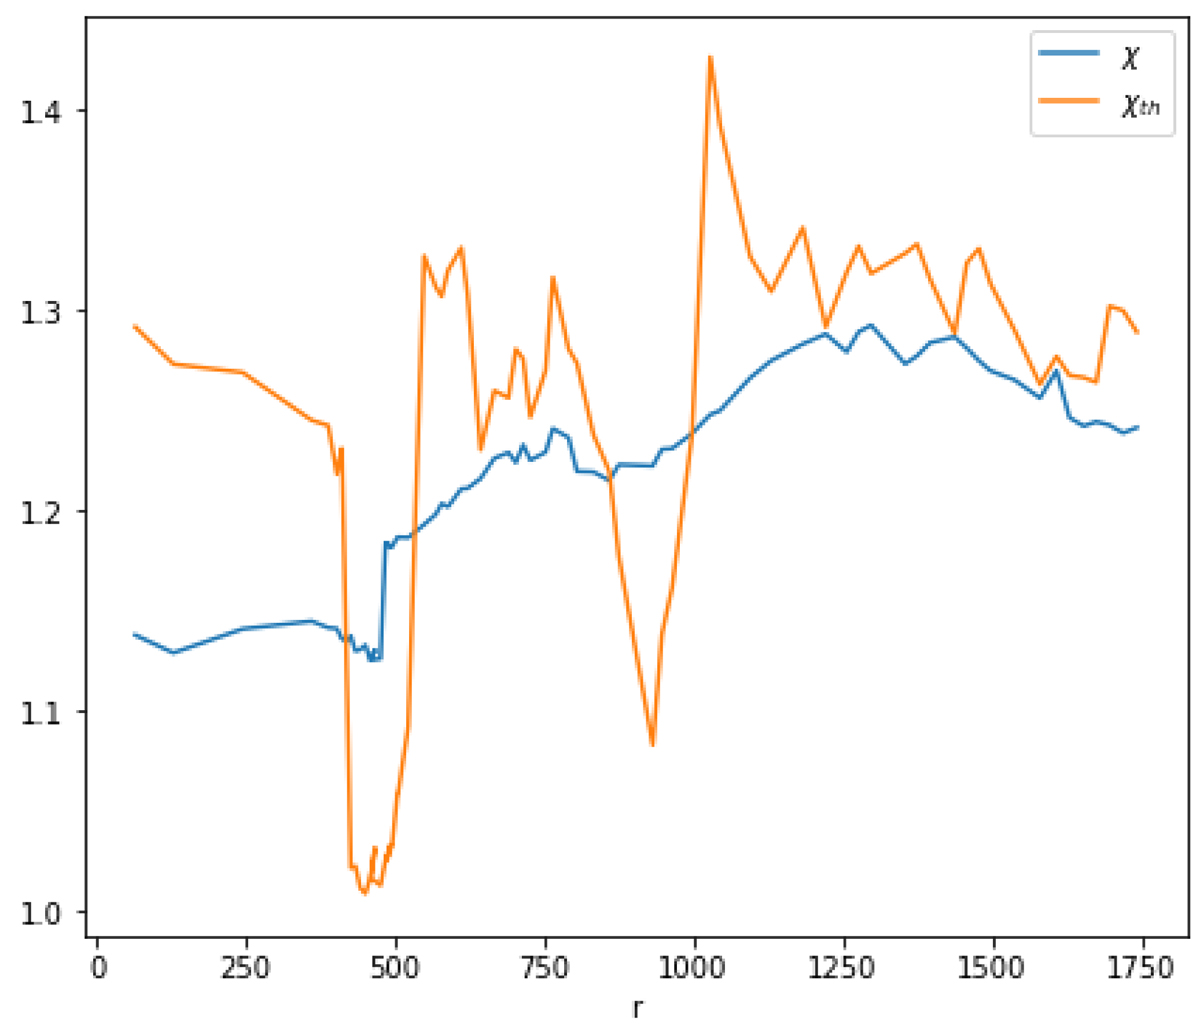
Distribution at tend along the main recollimation shock of the compression ratio for simulation K2. The yellow curve is the theoretical solution χth of Eq. C.5, computed using the pre-shock quantities, while the blue curve is the ratio χ = ρ2/ρ1.
Current usage metrics show cumulative count of Article Views (full-text article views including HTML views, PDF and ePub downloads, according to the available data) and Abstracts Views on Vision4Press platform.
Data correspond to usage on the plateform after 2015. The current usage metrics is available 48-96 hours after online publication and is updated daily on week days.
Initial download of the metrics may take a while.