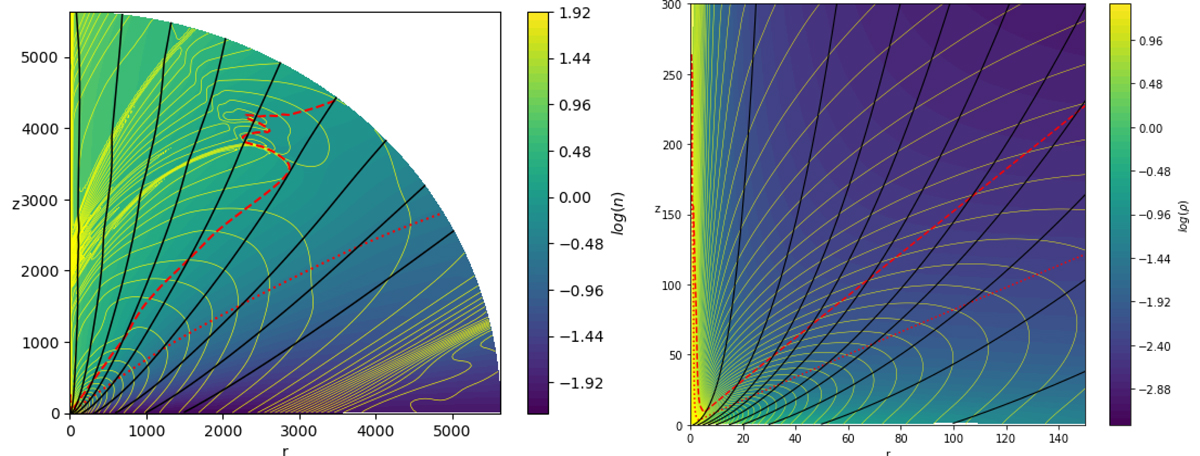
Fig. 2.
Download original image
Snapshot at tend of our Blandford & Payne simulation K2. Left: global view with field lines anchored on the disk at ro = 3; 15; 40; 80; 160; 320; 600; 1000; 1500, where the background is the logarithm of the FM mach number n. Right: close-up view of the innermost regions, where the background is the logarithm of the density. In both panels, black solid lines are the poloidal magnetic surfaces, the yellow solid lines are isocontours of the poloidal electrical current, and the red dashed (resp. dotted) line is the FM (resp. Alfvén) critical surface.
Current usage metrics show cumulative count of Article Views (full-text article views including HTML views, PDF and ePub downloads, according to the available data) and Abstracts Views on Vision4Press platform.
Data correspond to usage on the plateform after 2015. The current usage metrics is available 48-96 hours after online publication and is updated daily on week days.
Initial download of the metrics may take a while.