Open Access
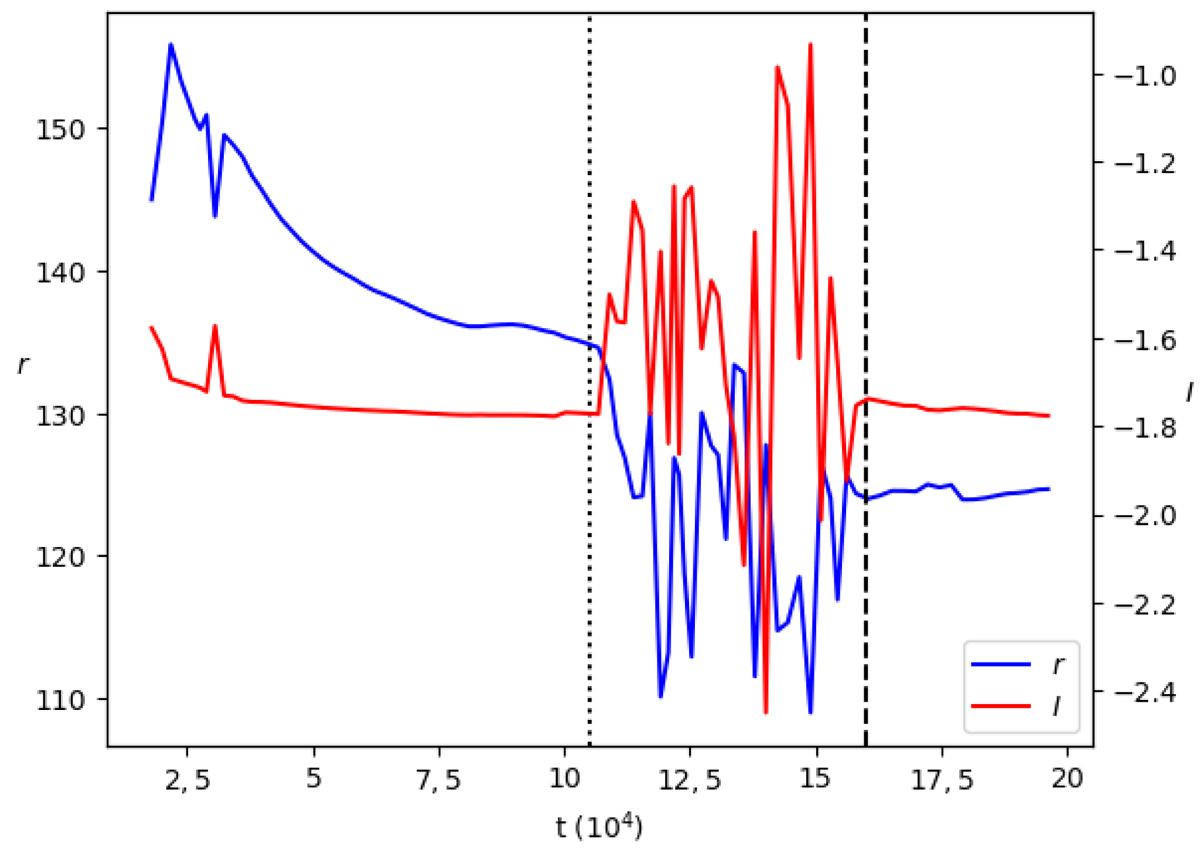
Fig. 14.
Download original image
Time evolution of the cylindrical radius r measured at Z = 3500 of the magnetic surface anchored at ro = 3 (blue curve) and the electric current I = rBϕ (red) flowing within that surface for simulation K2. The two vertical dashed lines correspond to t5 = 1.05 × 10⁵ and t6 = 1.58 × 10⁵.
Current usage metrics show cumulative count of Article Views (full-text article views including HTML views, PDF and ePub downloads, according to the available data) and Abstracts Views on Vision4Press platform.
Data correspond to usage on the plateform after 2015. The current usage metrics is available 48-96 hours after online publication and is updated daily on week days.
Initial download of the metrics may take a while.