Fig. 13.
Download original image
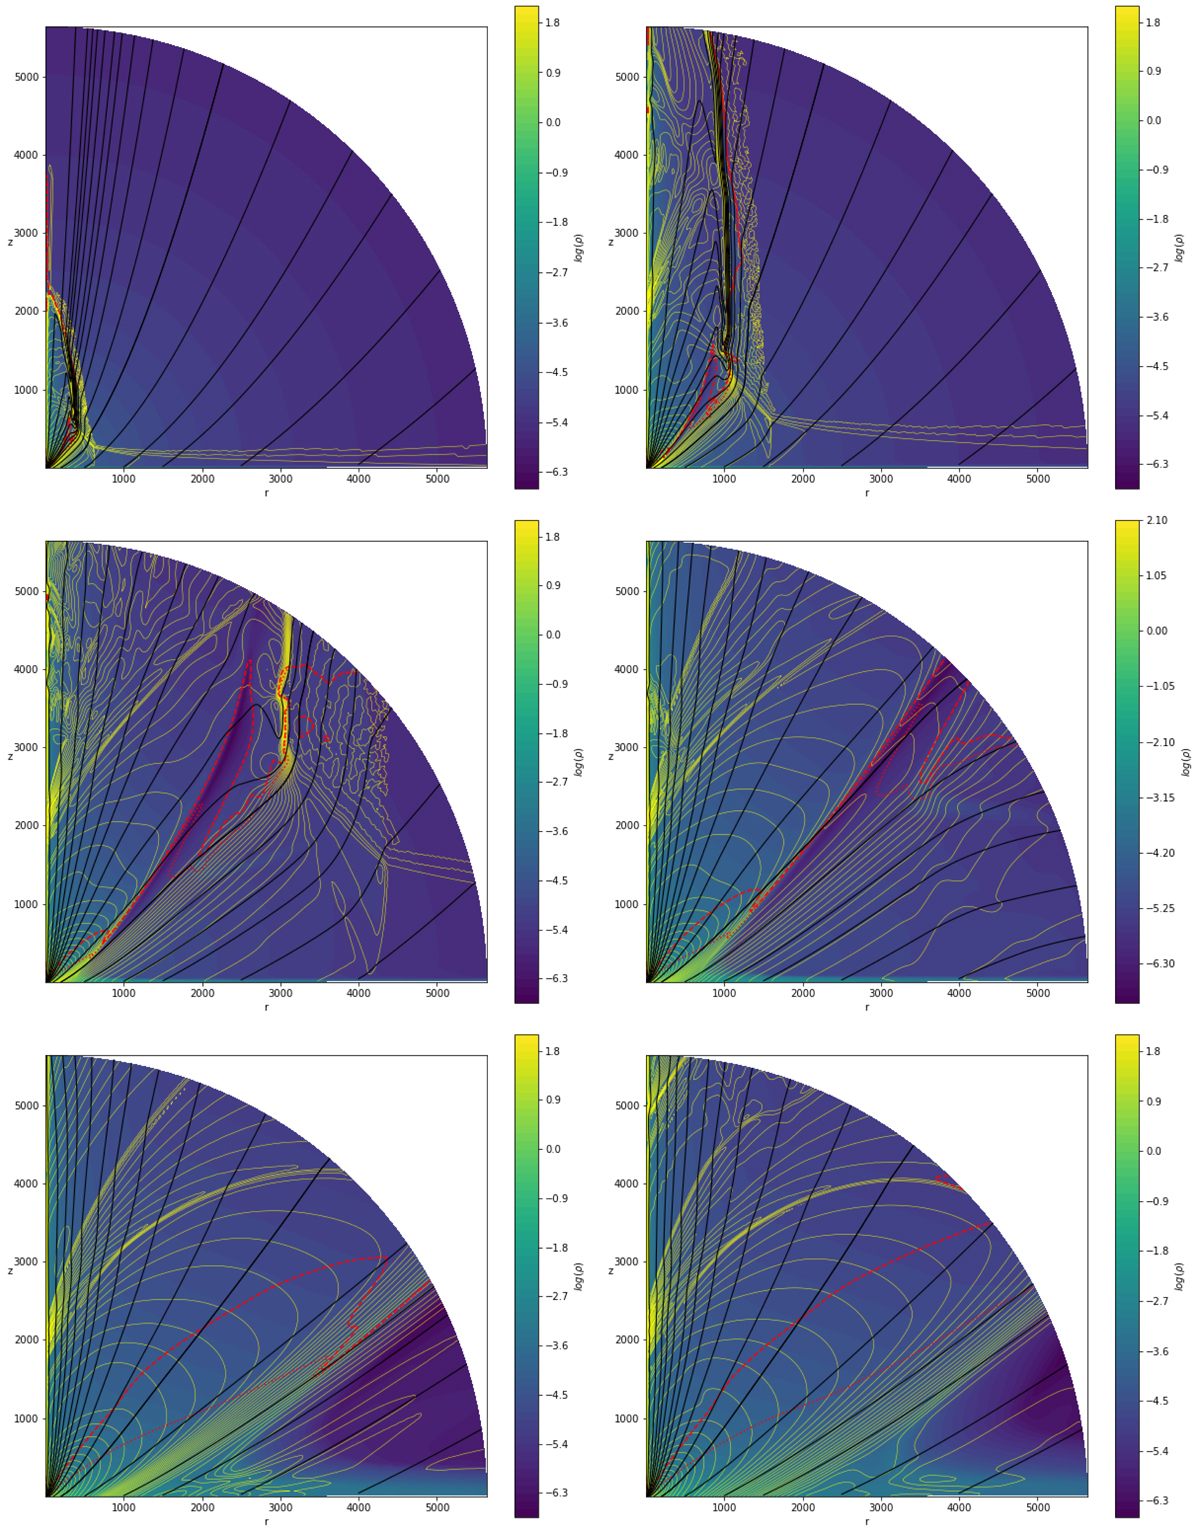
Snapshots of our reference simulation K2 at different times (given in Td units). From top to bottom, left to right: t1 = 551, t2 = 2.08 × 10³, t3 = 8.51 × 10³, t4 = 1.99 × 10⁴, t5 = 1.05 × 10⁵, and t6 = 1.58 × 10⁵. The background color is the logarithm of the density, black lines are the magnetic surfaces, red lines the Alfvén (dotted) and FM (dashed) surfaces, and yellow curves are isocontours of the poloidal electric current.
Current usage metrics show cumulative count of Article Views (full-text article views including HTML views, PDF and ePub downloads, according to the available data) and Abstracts Views on Vision4Press platform.
Data correspond to usage on the plateform after 2015. The current usage metrics is available 48-96 hours after online publication and is updated daily on week days.
Initial download of the metrics may take a while.