Open Access
Fig. 12.
Download original image
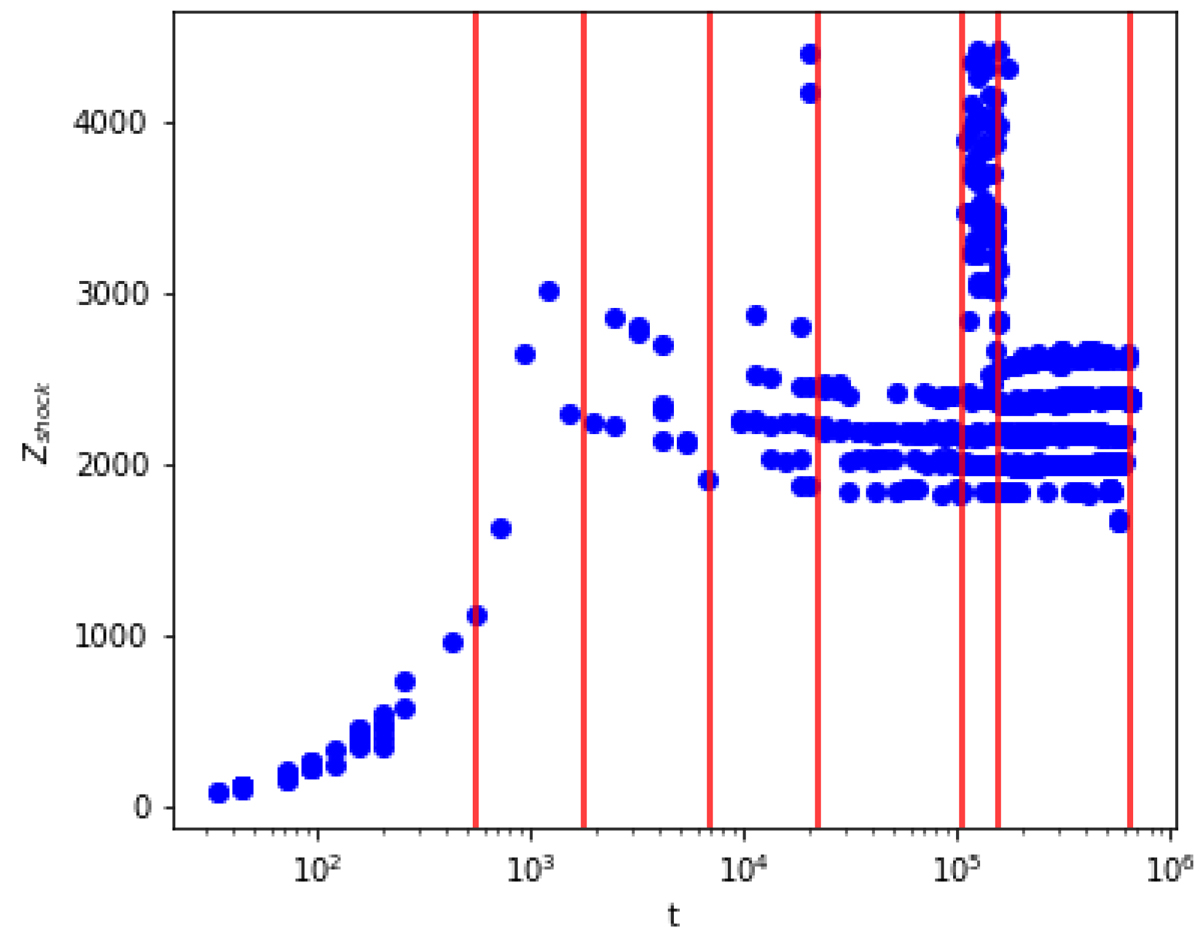
Altitude Z of the different shocks (measured at the axis) as a function of time (in Td units) for simulation K2. The vertical lines correspond to the six times ti used in Fig. 13: t1 = 551, t2 = 2.08 × 10³, t3 = 8.51 × 10³, t4 = 1.99 × 10⁴, t5 = 1.05 × 10⁵, and t6 = 1.58 × 10⁵. The last vertical line is tend = 6.51 × 10⁵.
Current usage metrics show cumulative count of Article Views (full-text article views including HTML views, PDF and ePub downloads, according to the available data) and Abstracts Views on Vision4Press platform.
Data correspond to usage on the plateform after 2015. The current usage metrics is available 48-96 hours after online publication and is updated daily on week days.
Initial download of the metrics may take a while.