Fig. 11.
Download original image
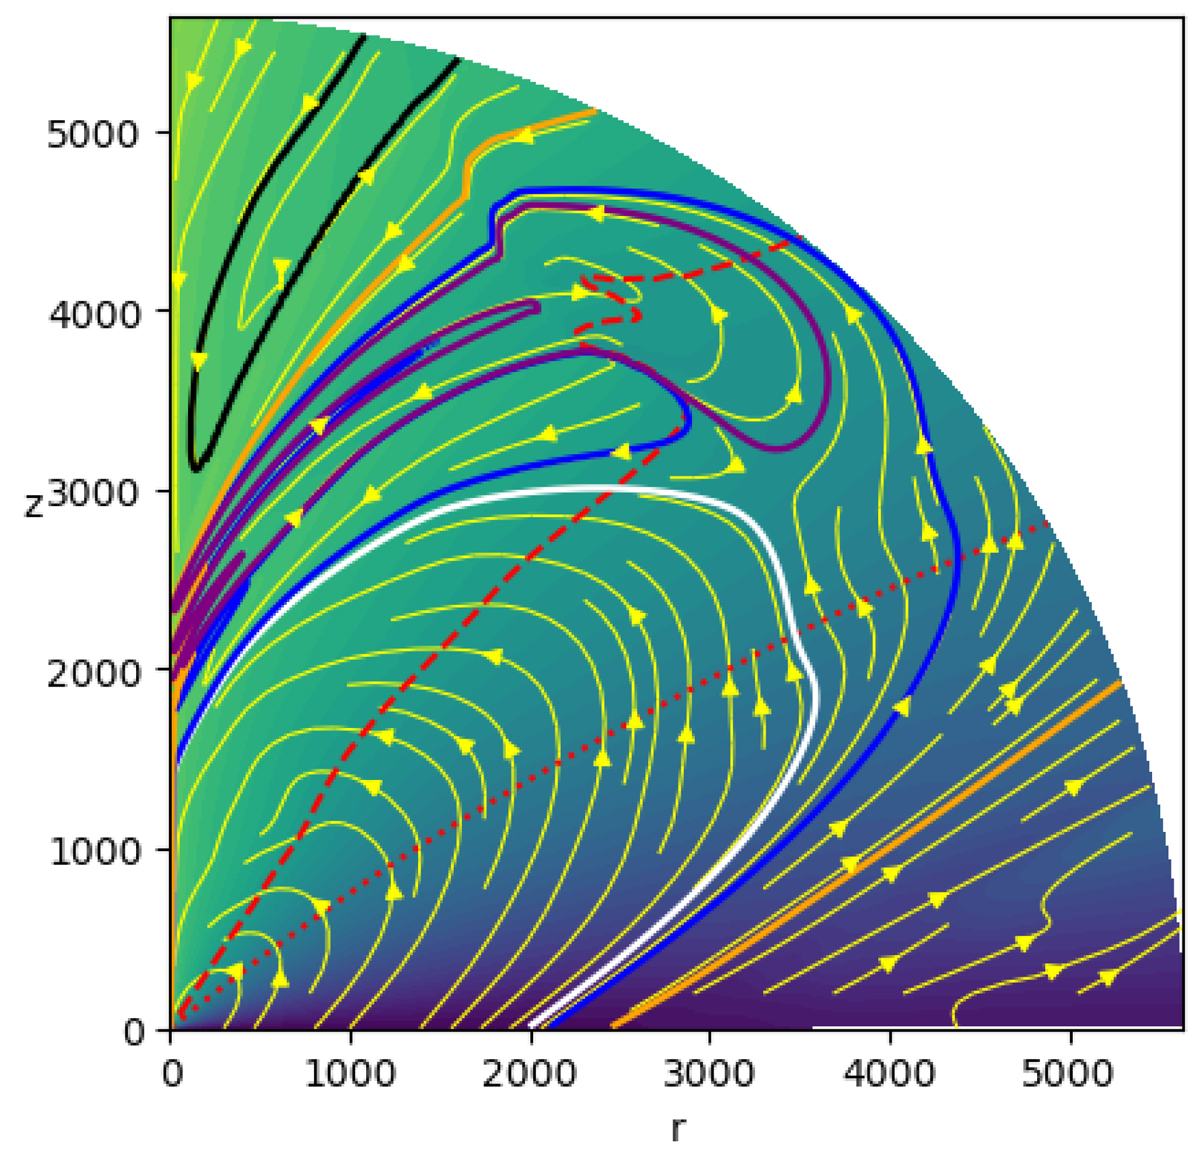
Plot of the poloidal electric circuits at tend for simulation K2. The two red curves are the critical surfaces, Alfvén (dotted) and FM (dashed). The yellow curves are the poloidal electric circuits, defined as isocontours of rBϕ, where the arrow indicate the direction of the poloidal current density Jp. Four circuits are highlighted in particular: (1) the envelope of the inner accelerating current in white (rBϕ = −2.06), (2) the outermost circuit still fully enclosed within the domain in blue (Bϕ = −2.005), (3) a circuit closed outside the domain in orange (rBϕ = −1.80), and (4) a post-shock accelerating circuit in purple (also with rBϕ = −2.06).
Current usage metrics show cumulative count of Article Views (full-text article views including HTML views, PDF and ePub downloads, according to the available data) and Abstracts Views on Vision4Press platform.
Data correspond to usage on the plateform after 2015. The current usage metrics is available 48-96 hours after online publication and is updated daily on week days.
Initial download of the metrics may take a while.