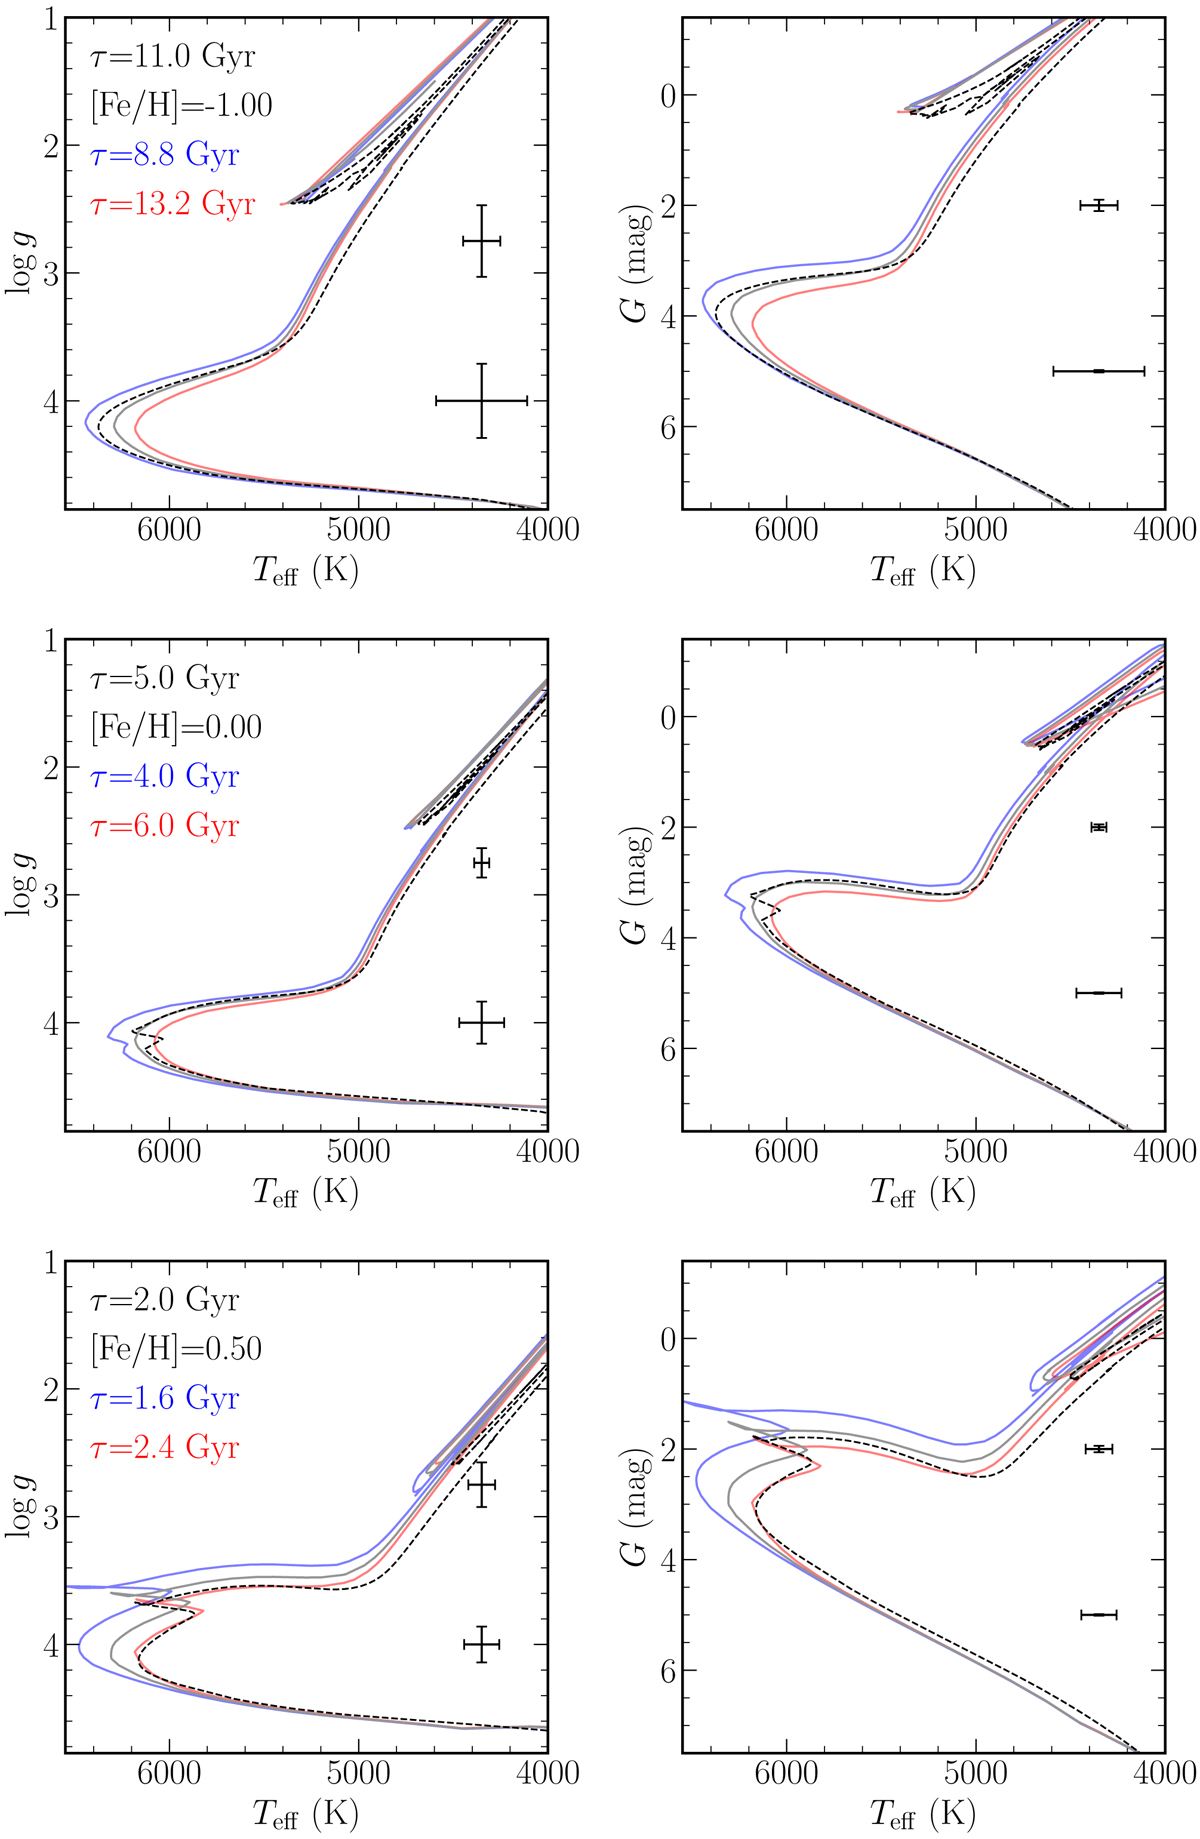
Fig. 6.
Download original image
MIST isochrones (dashed black lines) in two different spaces: Teff vs. log g (left) and Teff vs. G (right), for an old metal-poor population (top), a 5 Gyr solar metallicity population (middle), and a young super-solar metallicity population (bottom). In each panel, three PARSEC isochrones with the same metallicity are plotted, one at equal age (grey solid line), one at τ − 20 per cent (blue solid line), and one at τ + 20 per cent (red solid line). Typical Teff, log g, and G uncertainties (Q50) for giants (log g < 3.5) and dwarfs (log g > 3.5) for stars at [M/H] = [Fe/H] ± 0.2 dex are also plotted on the right side of each panel.
Current usage metrics show cumulative count of Article Views (full-text article views including HTML views, PDF and ePub downloads, according to the available data) and Abstracts Views on Vision4Press platform.
Data correspond to usage on the plateform after 2015. The current usage metrics is available 48-96 hours after online publication and is updated daily on week days.
Initial download of the metrics may take a while.