Fig. 3.
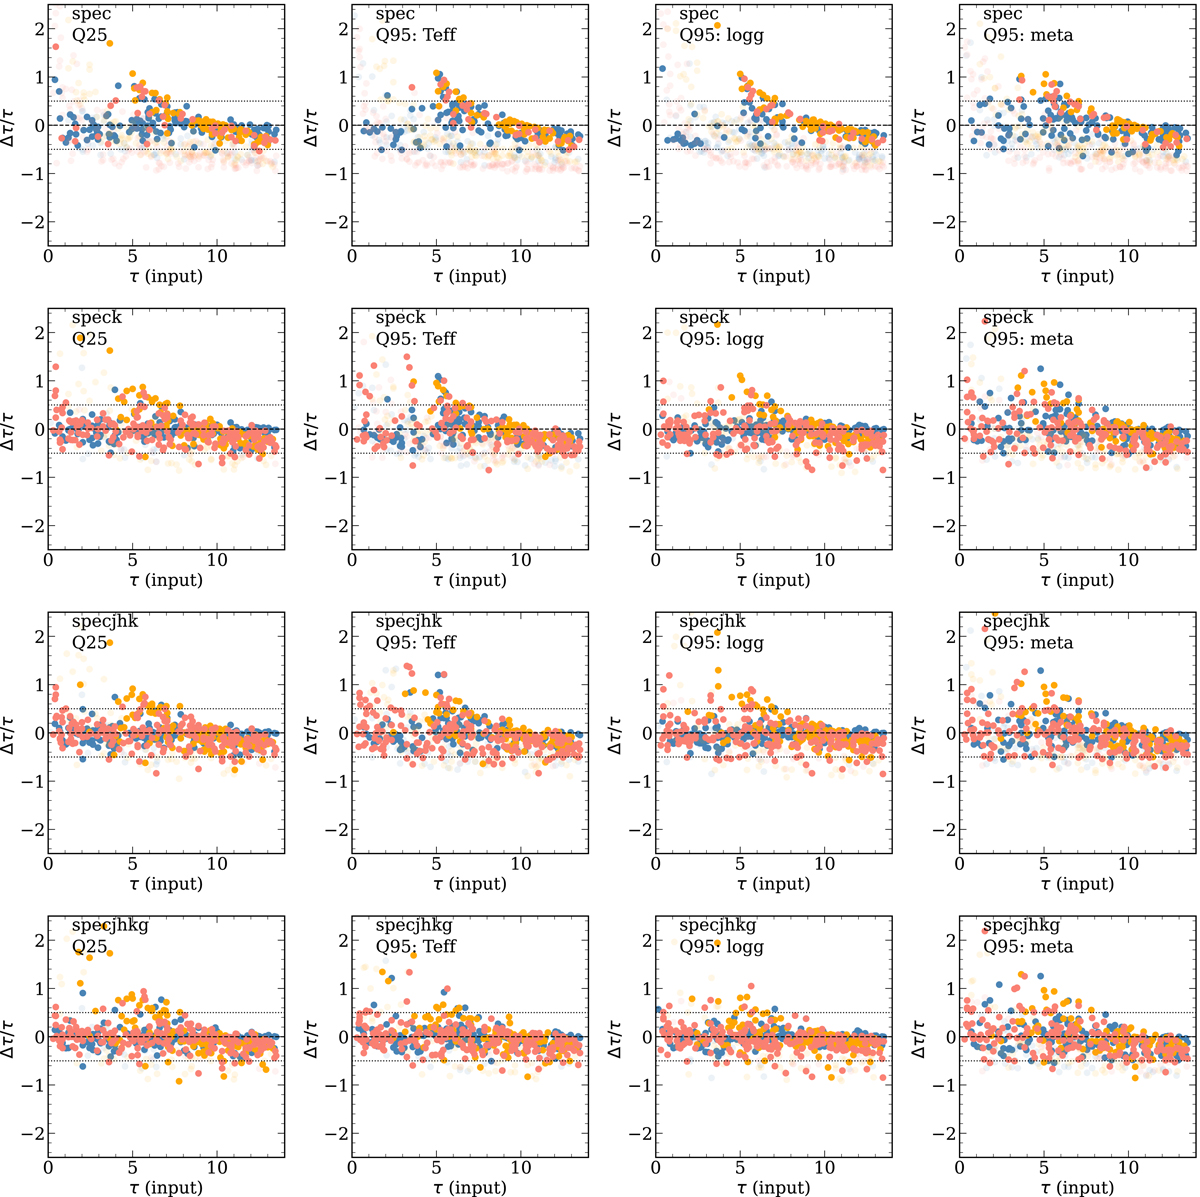
Download original image
True vs. relative age error (i.e. (output-input)/input) for the test sample of synthetic data. The blue, orange, and red points represent turn-off, main-sequence, and red giant stars, respectively. The dashed black line represents the 1:1 relation, where a star with a perfectly well estimated age should lie. The dotted lines show deviations from perfect estimation of ±50 per cent. Input parameters are randomised according to the Q25 uncertainties (see Table 1) unless specified in the top left corner. The first row plots consider a projection of only Teff, log g, and [M/H] (labelled spec), whereas rows two to four also consider the Ks magnitude (speck); the J, H, Ks magnitudes (specjhk); and the J, H, Ks, G magnitudes (specjhkg), respectively. Finally, solid points are the stars for which the estimated relative age uncertainty is smaller than 50 per cent, whereas the semi-transparent points have estimated relative age uncertainties larger than 50 per cent. See Sect. 2.4 for further details.
Current usage metrics show cumulative count of Article Views (full-text article views including HTML views, PDF and ePub downloads, according to the available data) and Abstracts Views on Vision4Press platform.
Data correspond to usage on the plateform after 2015. The current usage metrics is available 48-96 hours after online publication and is updated daily on week days.
Initial download of the metrics may take a while.