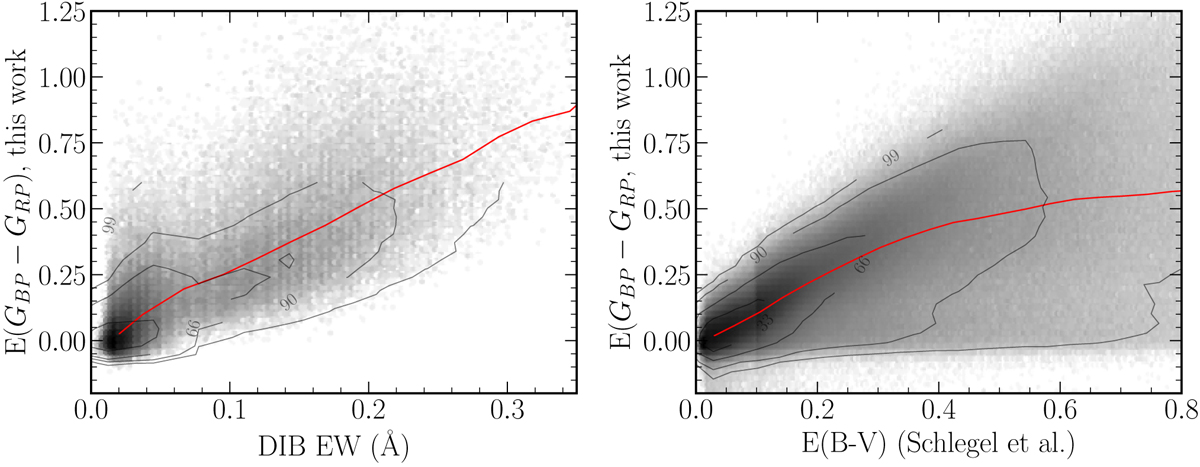
Fig. 13.
Download original image
Comparison of E(GBP − GRP) derived in this work, with the equivalent widths of diffuse interstellar bands at 862 nm derived from the same GSP-Spec spectra (left) and the Schlegel et al. (1998)E(B − V) with the Bonifacio et al. (2000) correction (right). For both plots, the grey colour-scale is the logarithm of the number of stars in one bin, and the red lines represent the running median. Overall, the correlations in both cases are very good.
Current usage metrics show cumulative count of Article Views (full-text article views including HTML views, PDF and ePub downloads, according to the available data) and Abstracts Views on Vision4Press platform.
Data correspond to usage on the plateform after 2015. The current usage metrics is available 48-96 hours after online publication and is updated daily on week days.
Initial download of the metrics may take a while.