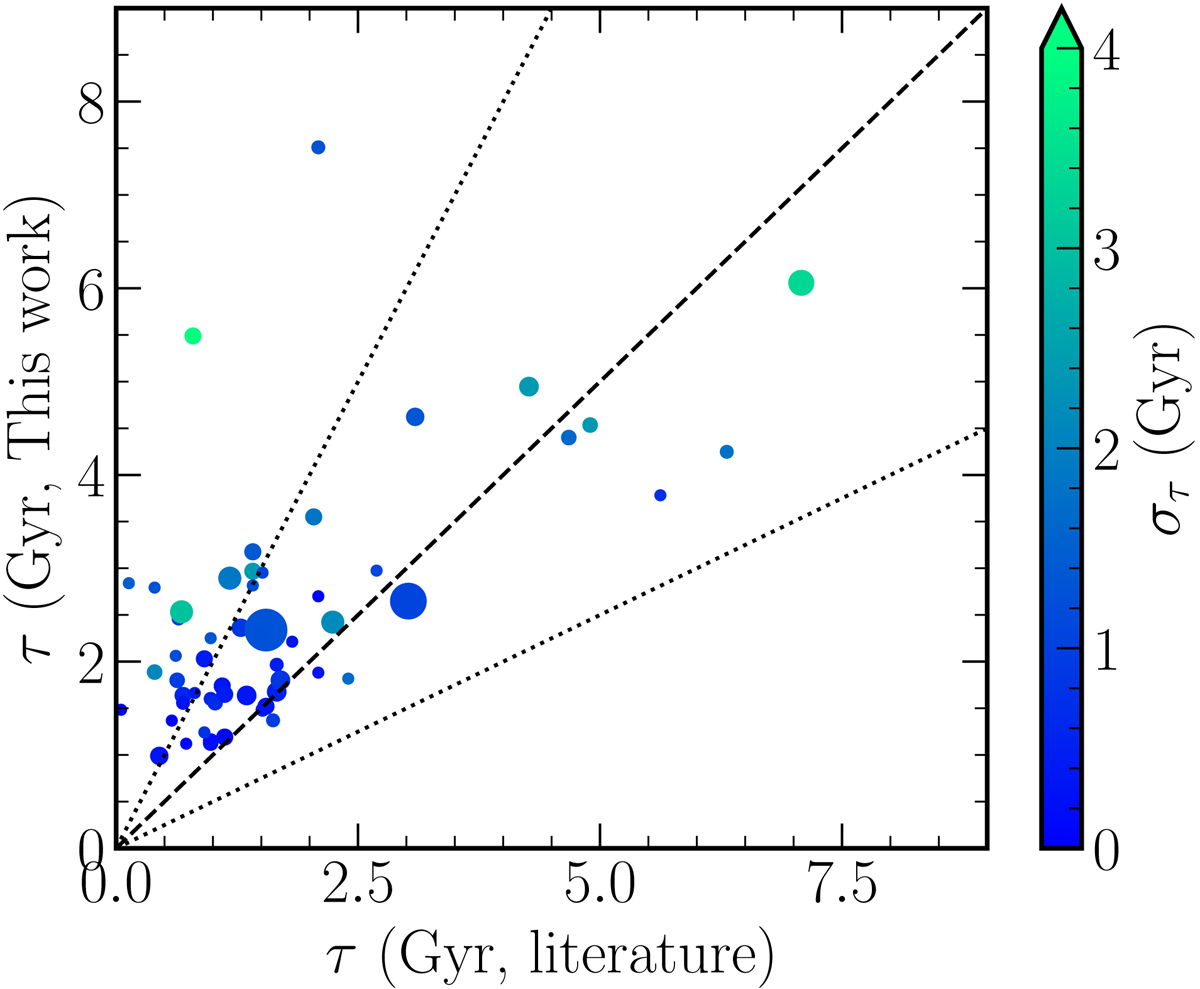
Fig. 11.
Download original image
Comparison of median open cluster ages with those of Cantat-Gaudin et al. (2020). The colour-coding corresponds to the age dispersion obtained within the cluster, and the size of the points is proportional to the number of cluster members that made our selection. A minimum of three stars per cluster is imposed. The dashed diagonal line represents the 1:1 relation, whereas the dotted lines show deviations from identity of ±50 per cent.
Current usage metrics show cumulative count of Article Views (full-text article views including HTML views, PDF and ePub downloads, according to the available data) and Abstracts Views on Vision4Press platform.
Data correspond to usage on the plateform after 2015. The current usage metrics is available 48-96 hours after online publication and is updated daily on week days.
Initial download of the metrics may take a while.