Open Access
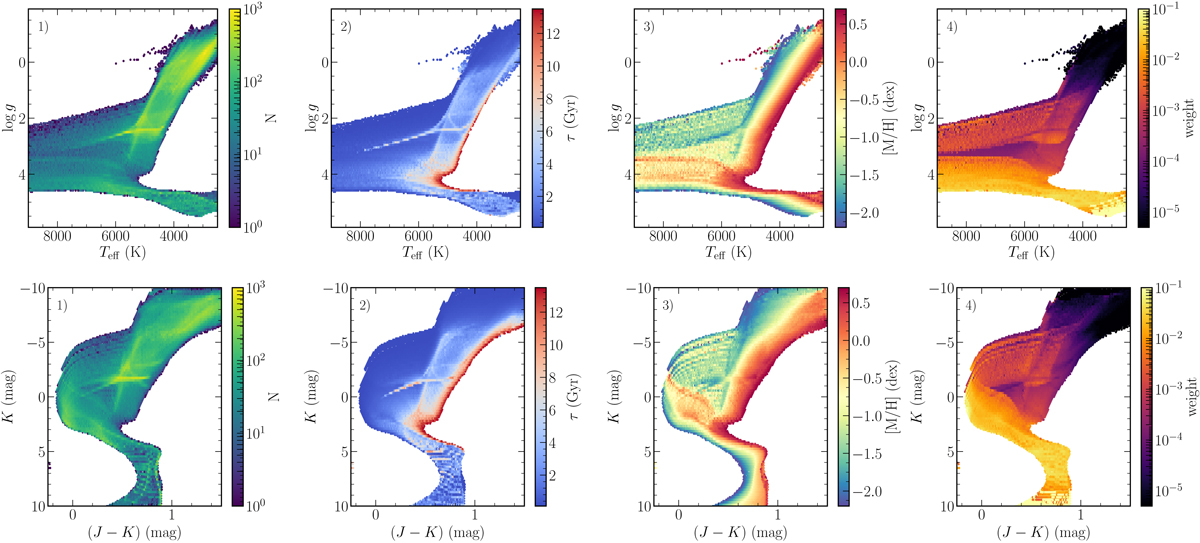
Fig. 1.
Download original image
Teff vs. log g (top) and (J − Ks) vs. Ks (bottom) hexbin plots of the isochrones employed in this work to derive the ages, masses, and reddenings. Panels 1: are colour-coded by density of points, Panels 2: by average age, Panels 3: by average metallicity, and Panels 4: by average evolutionary weight (factor βi in Eq. (1)).
Current usage metrics show cumulative count of Article Views (full-text article views including HTML views, PDF and ePub downloads, according to the available data) and Abstracts Views on Vision4Press platform.
Data correspond to usage on the plateform after 2015. The current usage metrics is available 48-96 hours after online publication and is updated daily on week days.
Initial download of the metrics may take a while.