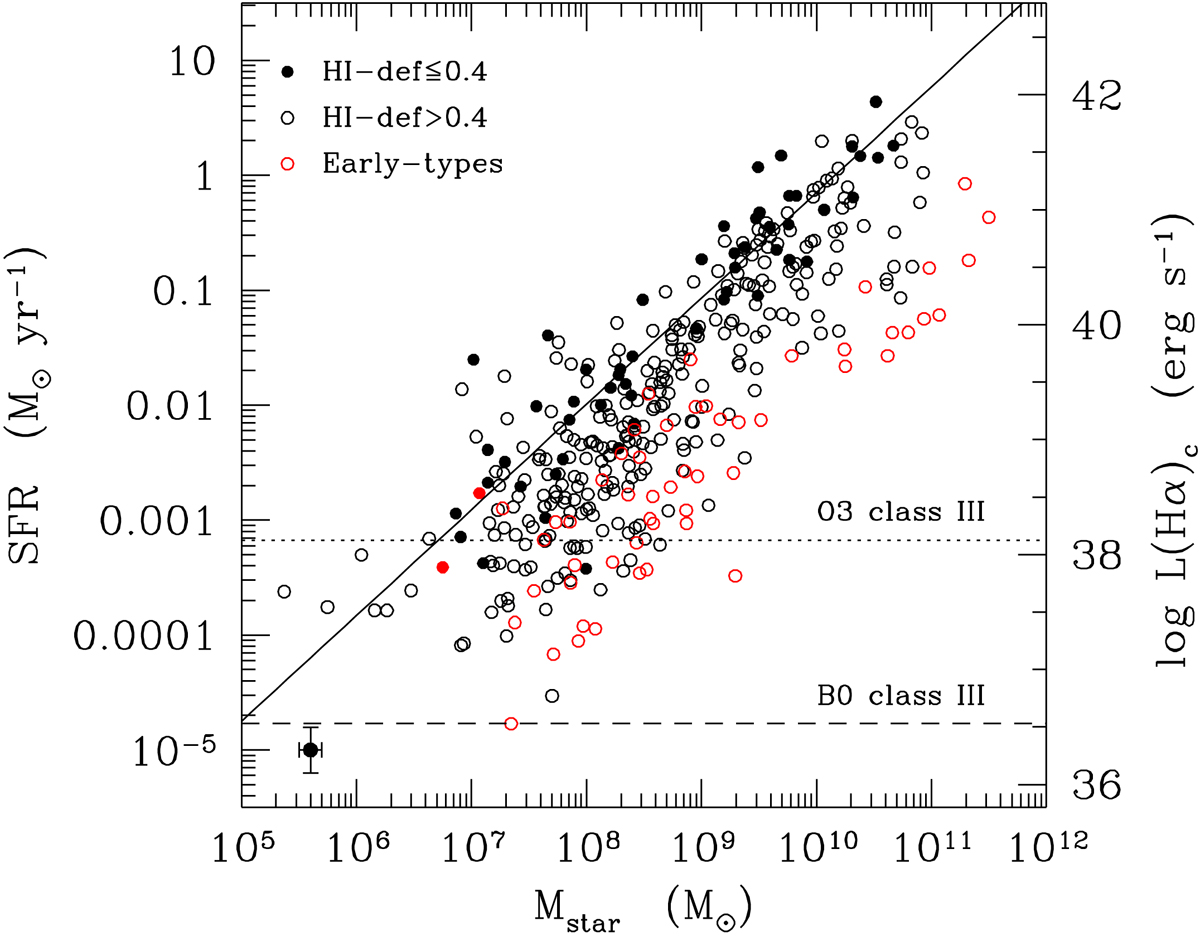
Fig. 8.
Download original image
Main-sequence relation for galaxies coded according to their morphological type and HI gas content: Late-type galaxies (≥Sa) are indicated by black symbols, and early-type galaxies are shown by red symbols. Filled dots are for HI gas-rich objects (HI-def ≤ 0.4), and HI-deficient objects (HI-def > 0.4) are shown by empty circles. Star formation rates were derived assuming stationary conditions. The Y-axis on the right side gives the corresponding Hα luminosities corrected for dust attenuation. The solid line is the best fit obtained for gas-rich star-forming systems. The horizontal dotted and dashed lines indicate the corresponding SFR derived using the number of ionising photons produced by an O3 class III and a B0 class III star as derived using the model atmospheres of Sternberg et al. (2003). The typical uncertainty on the data is shown in the lower left corner.
Current usage metrics show cumulative count of Article Views (full-text article views including HTML views, PDF and ePub downloads, according to the available data) and Abstracts Views on Vision4Press platform.
Data correspond to usage on the plateform after 2015. The current usage metrics is available 48-96 hours after online publication and is updated daily on week days.
Initial download of the metrics may take a while.