Fig. 7.
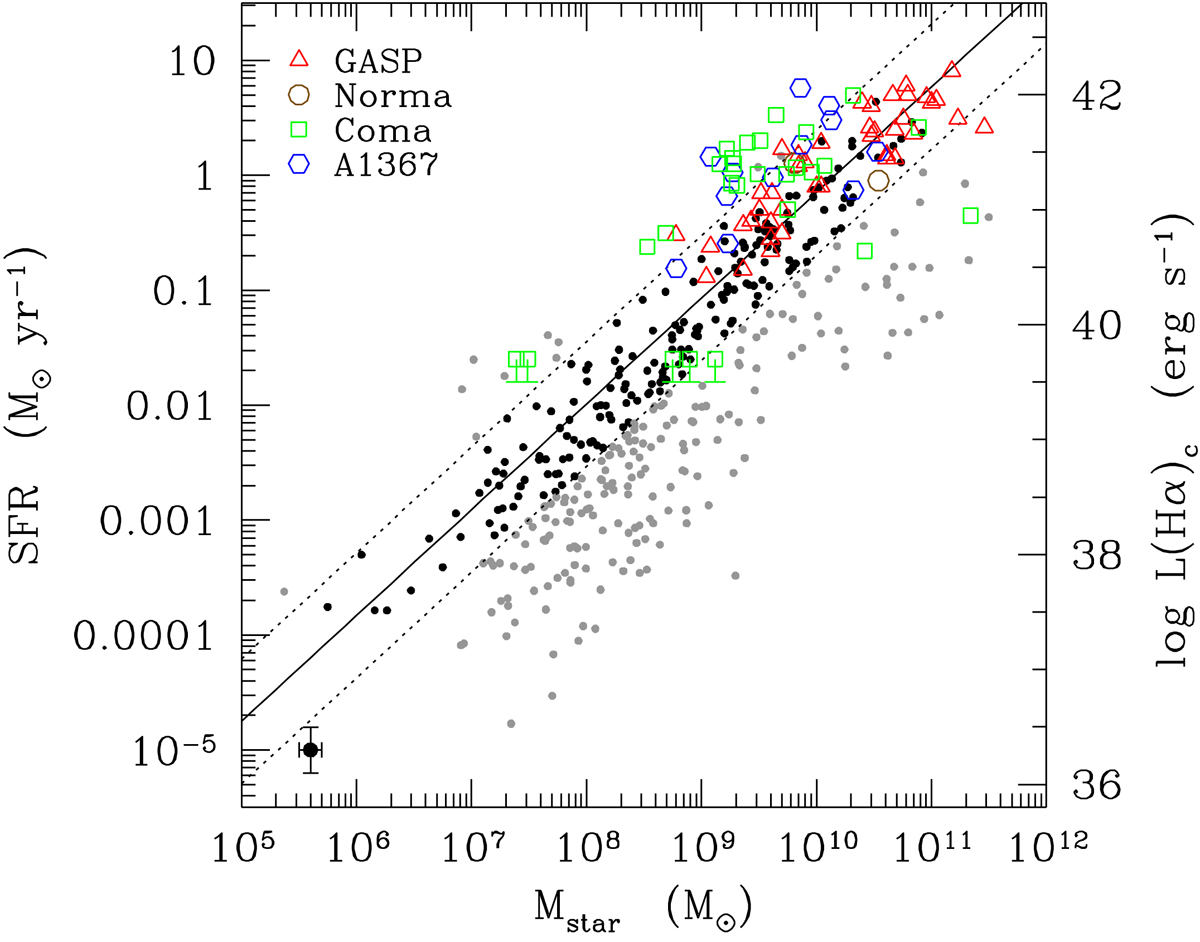
Download original image
Main-sequence relation for galaxies coded according to their distance to the best fit derived for HI gas-rich late-type systems. Filled black dots show galaxies within 1σ from the relation, and filled grey dots show galaxies > 1σ above or below the relation. The solid line gives the best fit obtained for gas-rich star-forming systems, and the dotted lines show the limits 1σ above and below the best fit. Galaxies undergoing a ram-pressure-stripping event identified in Boselli et al. (2022a) are indicated with large empty coloured symbols: brown circles show those belonging to the Norma cluster, green squares stand for Coma, and blue hexagons represent A1367. Red triangles indicate the jellyfish sample of Vulcani et al. (2018). Star formation rates and stellar masses are derived consistently with those measured within the Virgo cluster. The typical uncertainty on the data is shown in the lower left corner.
Current usage metrics show cumulative count of Article Views (full-text article views including HTML views, PDF and ePub downloads, according to the available data) and Abstracts Views on Vision4Press platform.
Data correspond to usage on the plateform after 2015. The current usage metrics is available 48-96 hours after online publication and is updated daily on week days.
Initial download of the metrics may take a while.