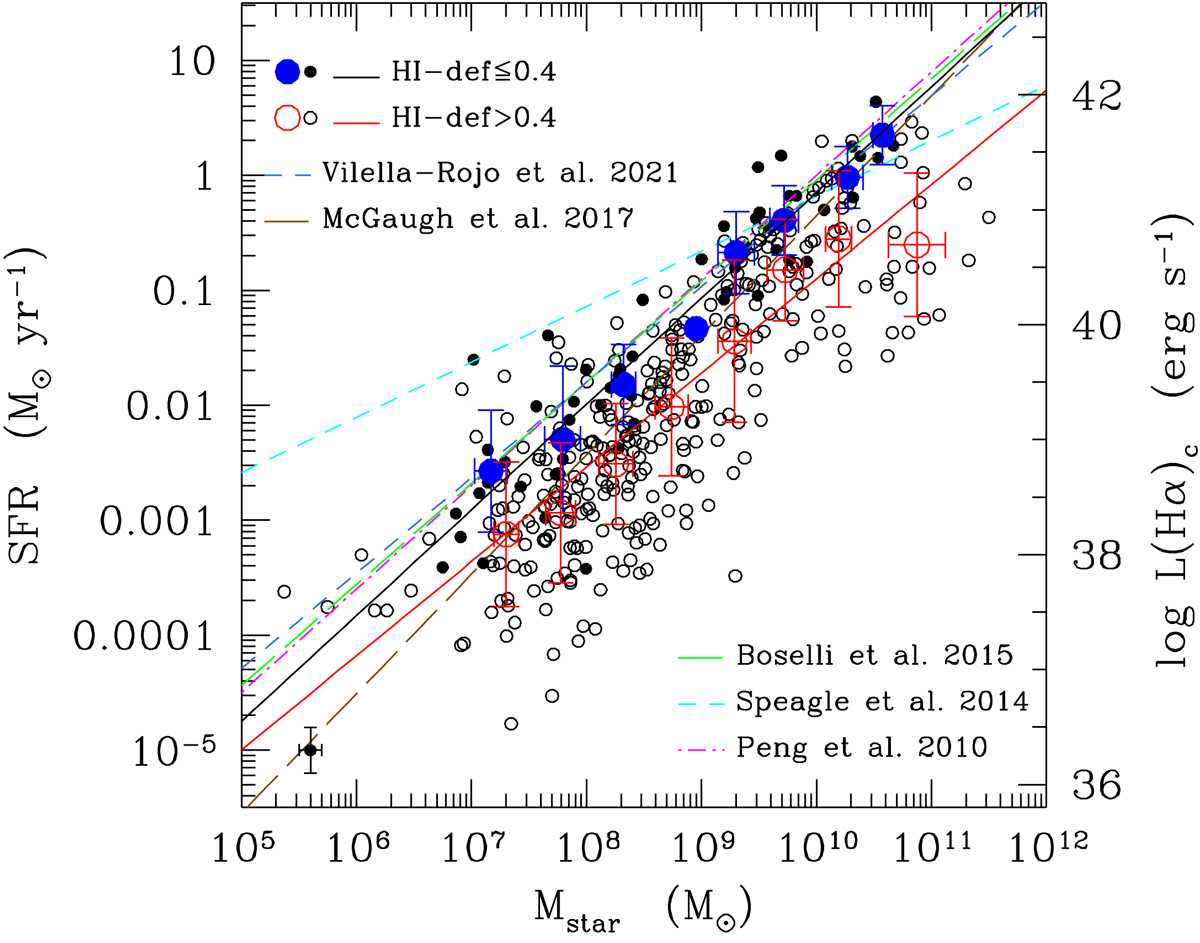
Fig. 5.
Download original image
Main-sequence relation for galaxies in the Virgo cluster coded according to their HI gas content: filled dots show HI gas-rich objects (HI-def ≤ 0.4), and empty circles represent HI-deficient objects (HI-def ≤ 0.4). Large solid blue and empty red circles are the mean values and standard deviations for HI-normal and HI-deficient objects. Star formation rates were derived assuming stationary conditions. The Y-axis on the right side gives the corresponding Hα luminosities corrected for dust attenuation. The solid black line is the best fit; obtained for gas-rich star-forming systems. The best fit is compared to those derived for bright galaxies with HI-def ≤ 0.4 included in the HRS (Boselli et al. 2015, bisector fit) and Speagle et al. (2014, derived extrapolating the time-dependent best-fit relation to z = 0), for the SDSS sample of Peng et al. (2010) derived for galaxies with Mstar ≥ 108.5 M⊙, for the local sample of Vilella-Rojo et al. (2021), and for the low surface brightness sample of McGaugh et al. (2017). The typical uncertainty on the data is shown in the lower left corner.
Current usage metrics show cumulative count of Article Views (full-text article views including HTML views, PDF and ePub downloads, according to the available data) and Abstracts Views on Vision4Press platform.
Data correspond to usage on the plateform after 2015. The current usage metrics is available 48-96 hours after online publication and is updated daily on week days.
Initial download of the metrics may take a while.