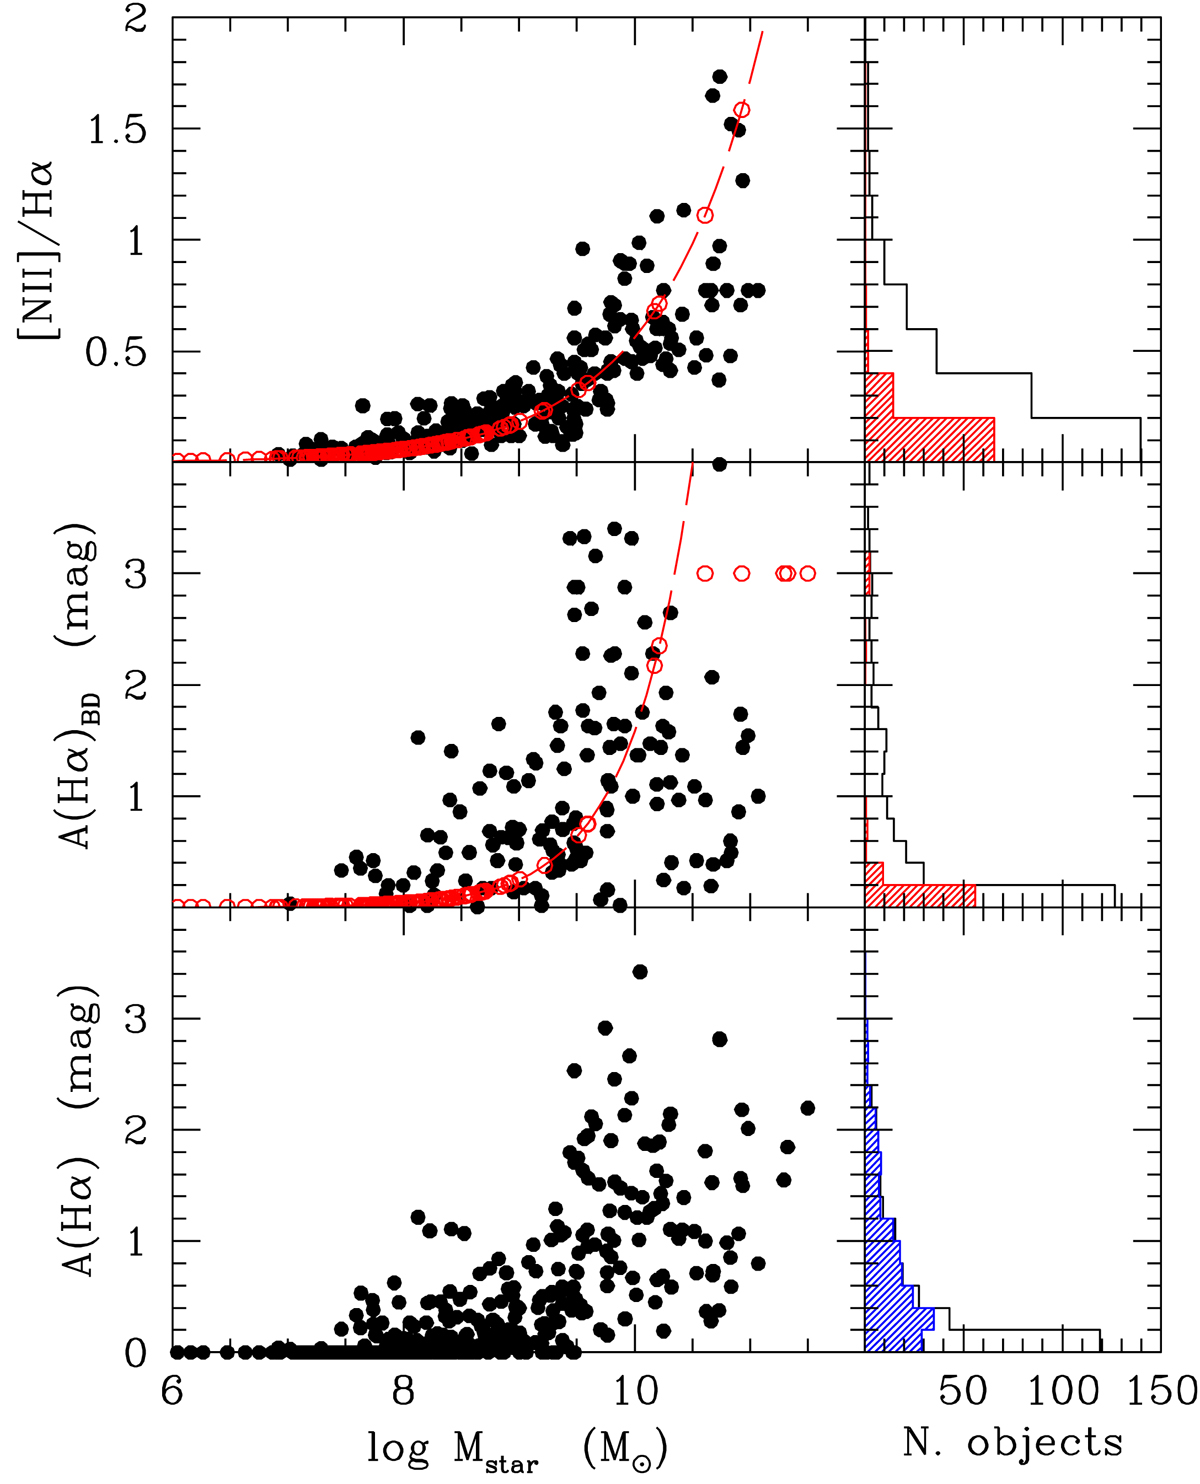
Fig. 2.
Download original image
Correction for [NII] contamination. Left panels: relation between the [NII]λ6548 + 6583 Å/Hα line ratio (upper panel), the dust attenuation measured using the Balmer decrement A(Hα)BD (middle panel), and the dust attenuation A(Hα) derived by averaging the Balmer decrement and the far-infrared determinations (see Sect. 3.3; lower panel) and the stellar mass of the selected galaxies. The long-dashed red lines indicate the mean relations derived in this work. Right panels: [NII]λ6548 + 6583 Å/Hα, A(Hα)BD, and A(Hα) distributions. The hatched red and blue histograms give the distribution of [NII]λ6548 + 6583 Å/Hα, A(Hα)BD, and A(Hα) derived from the mean scaling relations given in the text and adopted in the Hα flux correction for galaxies without any spectroscopic data.
Current usage metrics show cumulative count of Article Views (full-text article views including HTML views, PDF and ePub downloads, according to the available data) and Abstracts Views on Vision4Press platform.
Data correspond to usage on the plateform after 2015. The current usage metrics is available 48-96 hours after online publication and is updated daily on week days.
Initial download of the metrics may take a while.