Fig. A.2.
Download original image
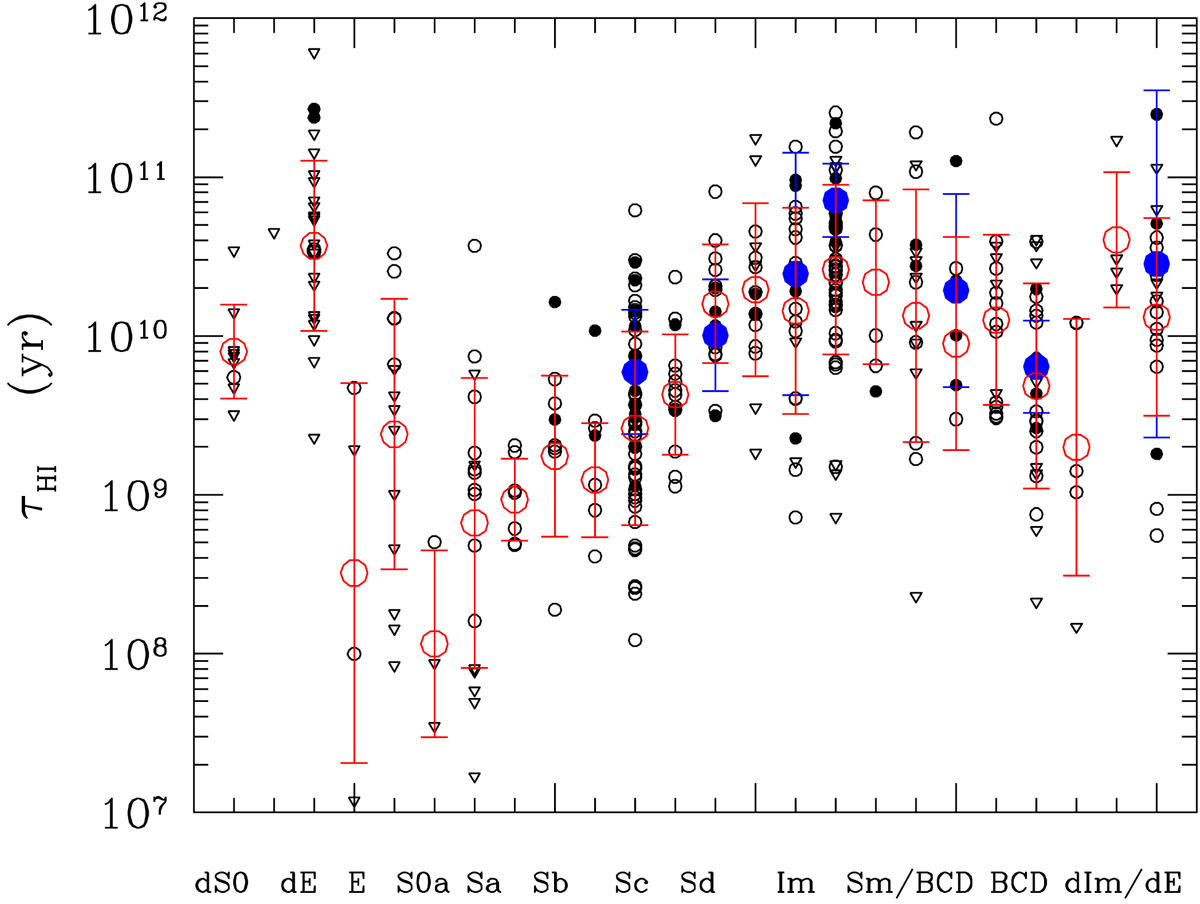
Relation between the HI gas depletion timescale and the morphological type for HI-normal (HI-def ≤0.4; filled dots) and HI-deficient (HI-def > 0.4; empty circles) galaxies. The large filled blue dots indicate the mean values for each morphological class for normal gas-rich systems, and the empty red dots show cluster HI-deficient galaxies. The error bar shows the standard deviation of the distribution for the large symbols. Upper limits are indicated by triangles and are treated as detections in the derivation of the mean values.
Current usage metrics show cumulative count of Article Views (full-text article views including HTML views, PDF and ePub downloads, according to the available data) and Abstracts Views on Vision4Press platform.
Data correspond to usage on the plateform after 2015. The current usage metrics is available 48-96 hours after online publication and is updated daily on week days.
Initial download of the metrics may take a while.