Fig. 17.
Download original image
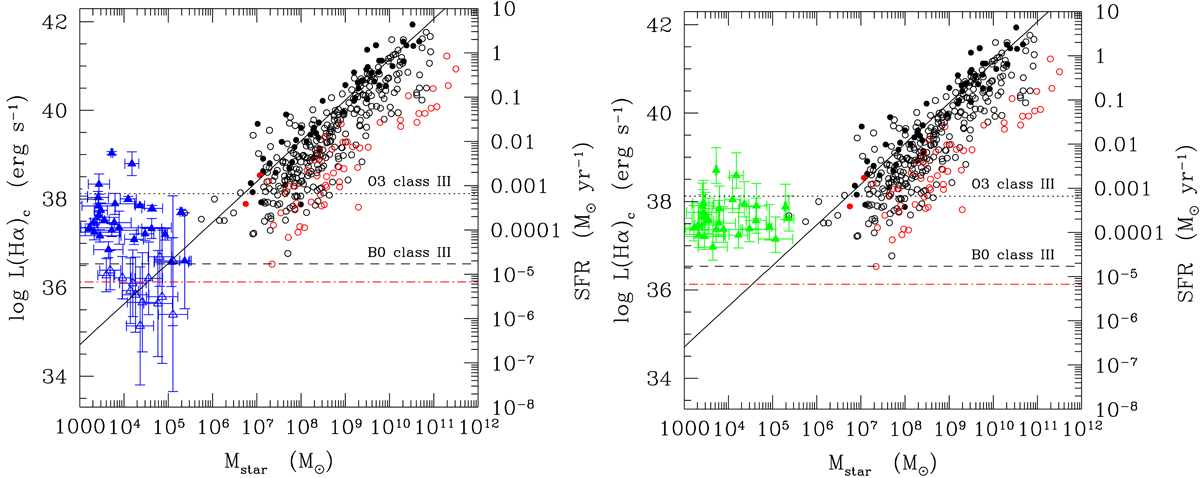
Main-sequence relation including extraplanar HII regions. Left panel: relation between the Hα luminosity (corrected for dust attenuation) and stellar mass for galaxies coded according to their morphological type and HI gas content: late-type galaxies (> Sa) are indicated by black symbols, and early-type galaxies by red symbols. Filled dots show HI gas-rich objects (HI-def ≤ 0.4), and HI-deficient objects (HI-def > 0.4) are shown by empty circles. The solid line is the best fit obtained for gas-rich star-forming systems. Blue triangles show the extraplanar HII regions detected in NGC 4254 (Boselli et al. 2018b), where stellar masses and star formation rates have been determined using the SED fitting code CIGALE. Filled triangles show Hα detected regions, and empty triangles stand for the undetected ones. The error bars of the HII regions of NGC 4254 are those given by the SED fitting analysis. The horizontal dotted and dashed lines indicate the corresponding SFR derived using the number of ionising photons produced by an O3 class III and a B0 class III star as derived using the model atmospheres of Sternberg et al. (2003). The dot-dashed red line indicates the corresponding completeness limit of VESTIGE at the mean distance of Virgo (16.5 Mpc). The right Y-axis gives the corresponding SFR (main-sequence relation) derived assuming stationary conditions. Right panel: similar plot, in which the green filled triangles are the extraplanar HII regions of NGC 4254 detected in Hα, where the stellar masses are derived using the SED fitting analysis with CIGALE, while the star formation rates are measured using the same calibration based on the Hα luminosity as for the galaxy sample, assuming A(Hα) = 0.7 mag and [NII]λ6584 Å/Hα = 0.2, as in Boselli et al. (2018b). The uncertainties on the stellar mass of the HII regions of NGC 4254 are given by the fitting code CIGALE, and those on their star formation rate indicate the dynamic range in this parameter assuming either A(Hα) = 0 mag or A(Hα) = 1.5 mag.
Current usage metrics show cumulative count of Article Views (full-text article views including HTML views, PDF and ePub downloads, according to the available data) and Abstracts Views on Vision4Press platform.
Data correspond to usage on the plateform after 2015. The current usage metrics is available 48-96 hours after online publication and is updated daily on week days.
Initial download of the metrics may take a while.