Fig. 14.
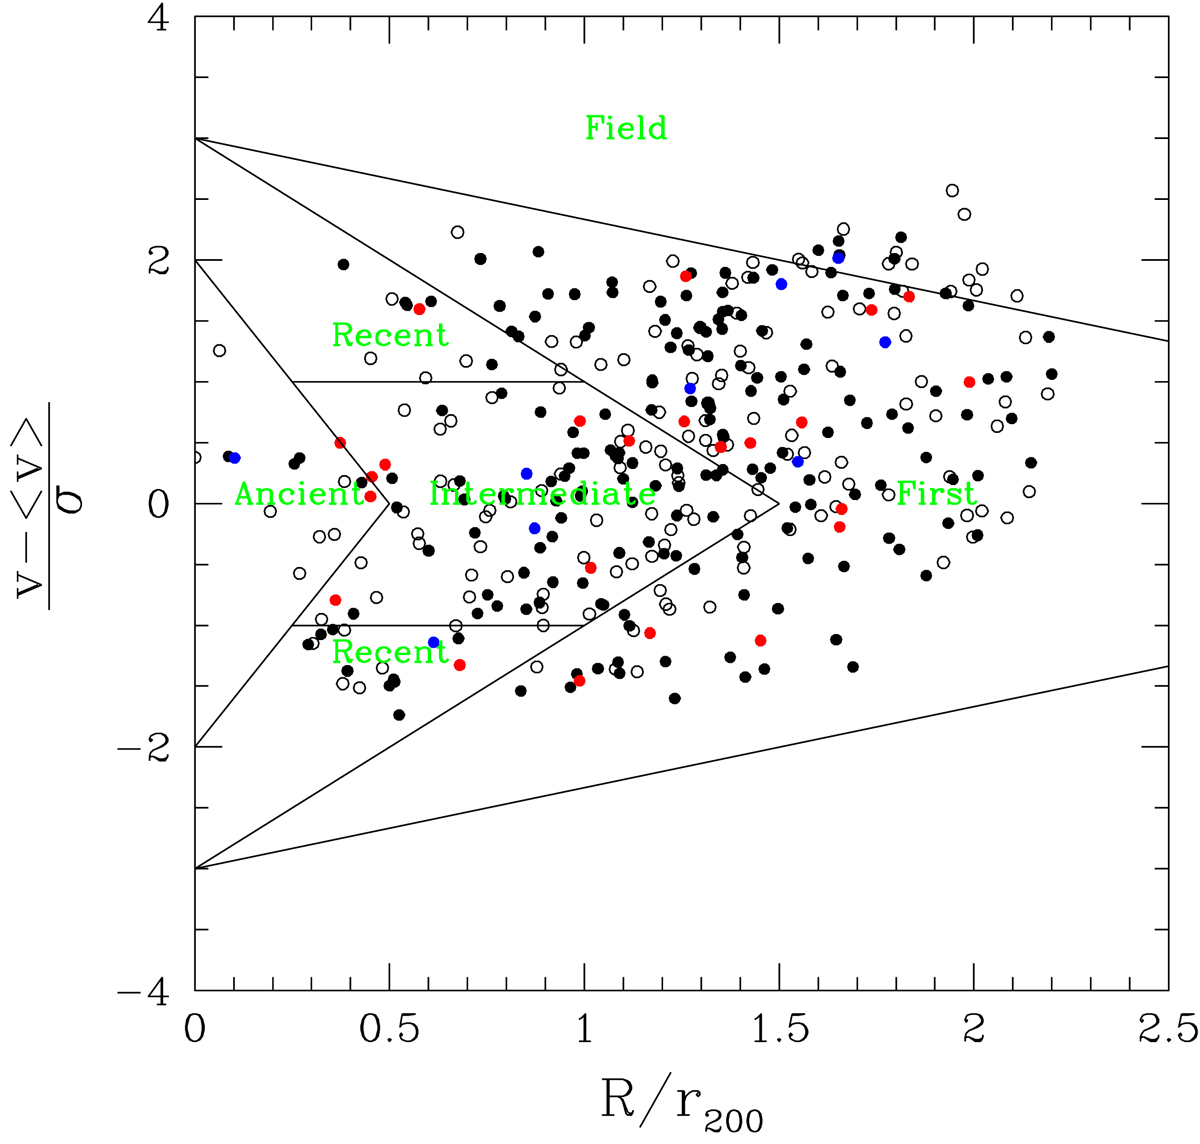
Download original image
Phase–space diagram for galaxies coded according to their distance from the best fit derived for HI gas-rich late-type systems. Filled black dots show galaxies within 1σ from the relation, filled blue dots show galaxies > 1σ above the relation, empty circles show galaxies 1σ–3σ below the relation, and filled dots show galaxies > 5σ below the relation. The solid lines delimit the different regions extracted from the simulations of Rhee et al. (2017) to identify galaxies in different phases of their infall into the cluster: first (not yet fallen), recent (0 < τinf < 3.6 Gyr), intermediate (3.6 < τinf < 6.5 Gyr), and ancient (6.5 < τinf < 13.7 Gyr) infallers.
Current usage metrics show cumulative count of Article Views (full-text article views including HTML views, PDF and ePub downloads, according to the available data) and Abstracts Views on Vision4Press platform.
Data correspond to usage on the plateform after 2015. The current usage metrics is available 48-96 hours after online publication and is updated daily on week days.
Initial download of the metrics may take a while.