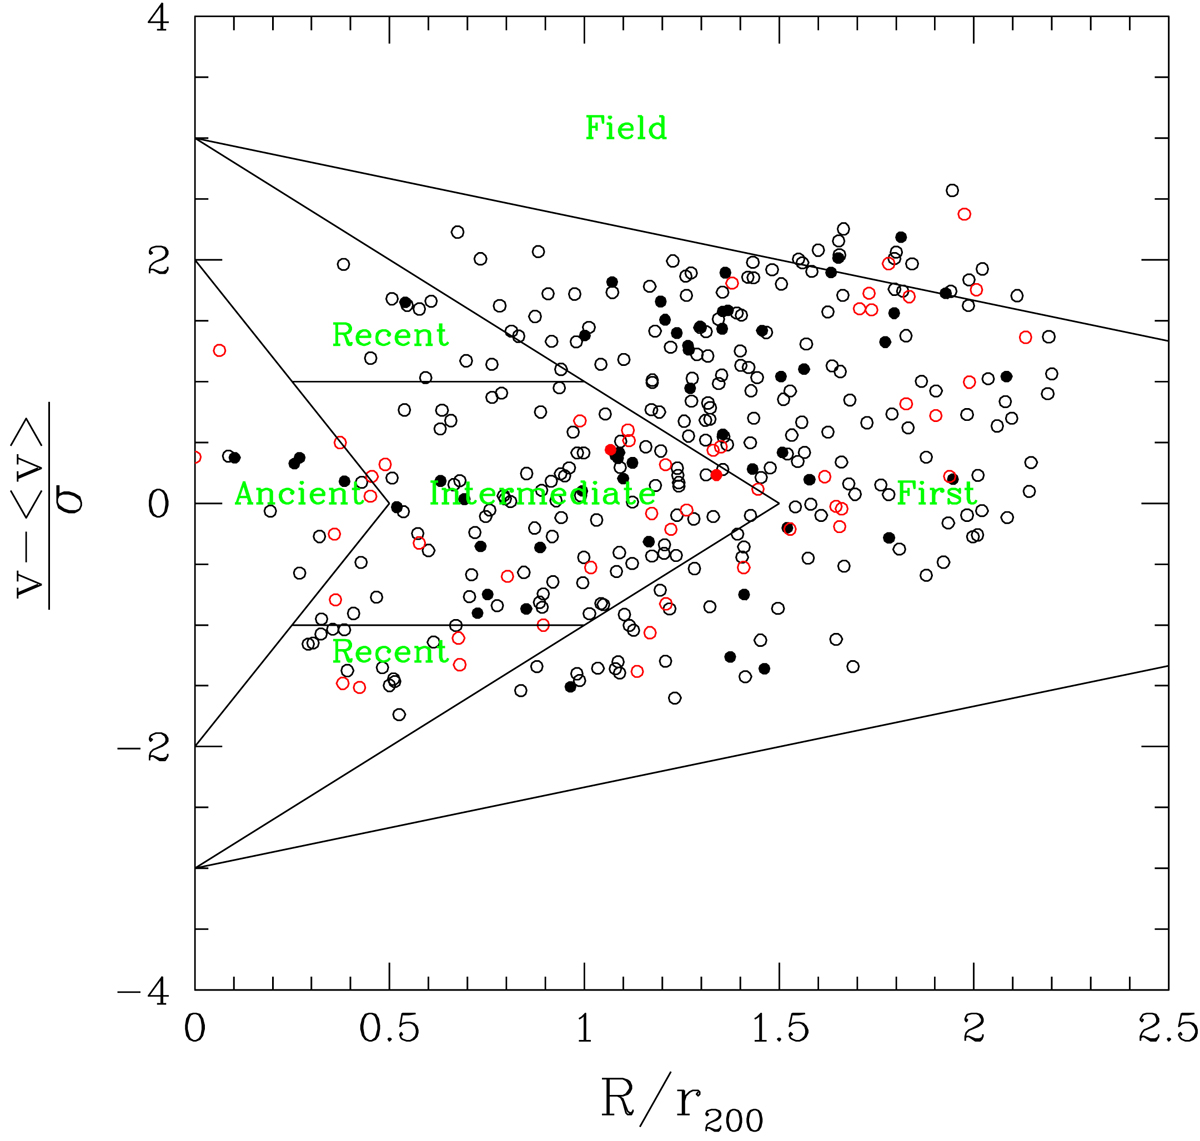
Fig. 12.
Download original image
Phase-space diagram for the Hα detected galaxies within the Virgo cluster. For all galaxies, the X-axis indicates the projected distance from the central galaxy M87 in units of r200, and the Y-axis shows the excess in velocity with respect to the mean velocity of cluster A (⟨v⟩ = 955 km s−1) normalised to its mean velocity dispersion (σ = 799 km s−1; Boselli et al. 2014c). Late-type galaxies (> Sa) are indicated by black symbols, and early-type galaxies are shown by red symbols. Filled dots show HI gas-rich objects (HI-def ≤ 0.4), and HI-deficient objects (HI-def > 0.4) are shown by empty circles. The solid lines delimit the different regions extracted from the simulations of Rhee et al. (2017) to identify galaxies in different phases of their infall into the cluster: first (not yet fallen), recent (0 < τinf < 3.6 Gyr), intermediate (3.6 < τinf < 6.5 Gyr), and ancient (6.5 < τinf < 13.7 Gyr) infallers.
Current usage metrics show cumulative count of Article Views (full-text article views including HTML views, PDF and ePub downloads, according to the available data) and Abstracts Views on Vision4Press platform.
Data correspond to usage on the plateform after 2015. The current usage metrics is available 48-96 hours after online publication and is updated daily on week days.
Initial download of the metrics may take a while.