Fig. 10.
Download original image
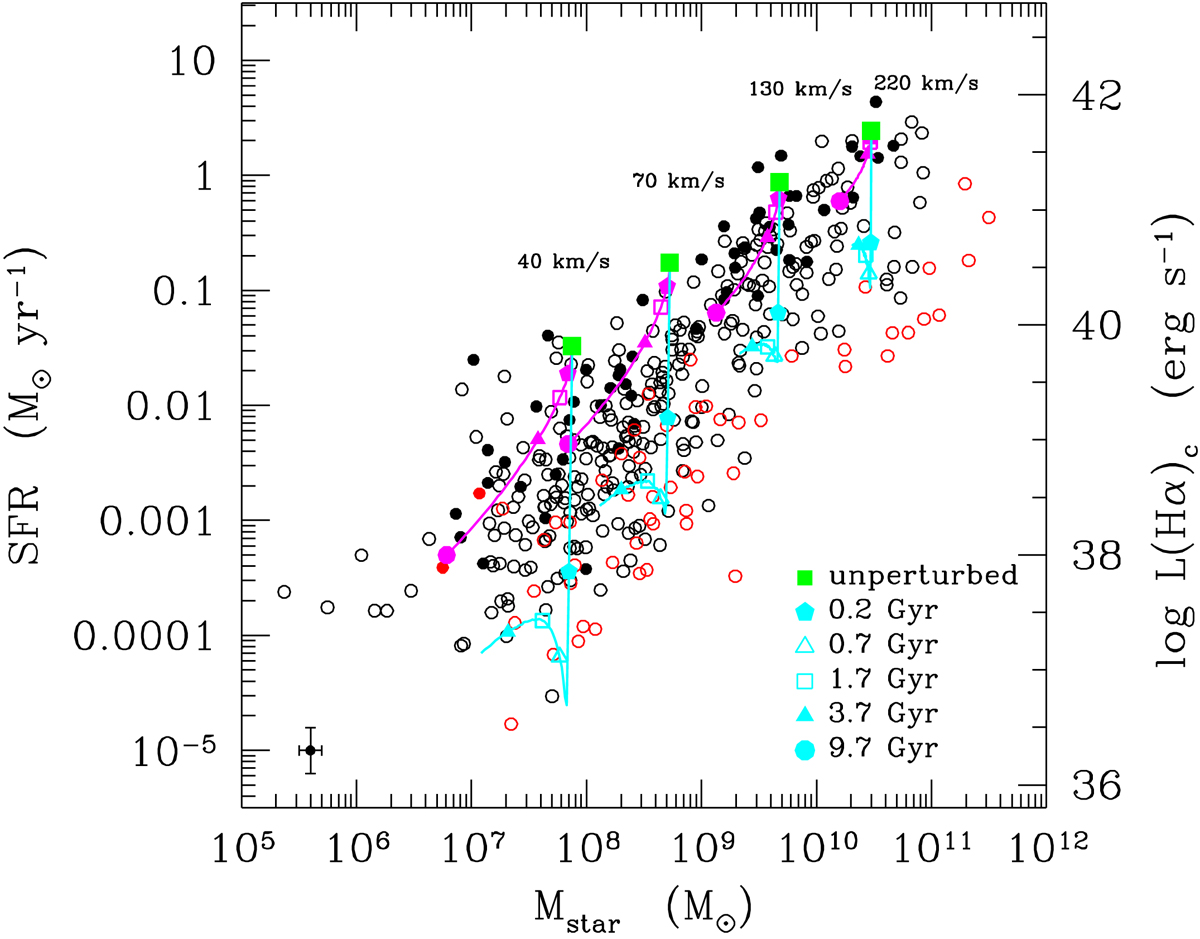
Comparison of the observed main-sequence relation with the predictions of ram-pressure-stripping models for galaxies with a spin parameter λ = 0.05 and rotational velocities of 40, 70, 130, and 220 km s−1. Unperturbed models are indicated with filled green squares, starvation models by the magenta lines, and ram-pressure-stripping models by the cyan lines. Different symbols for the models indicate the position of the model galaxies at a given look-back time from the beginning of the interaction. Black (red) filled circles show late-type (early-type) galaxies with a normal HI content (HI-def ≤ 0.4), and black (red) empty circles show HI-deficient (HI-def > 0.4) late-type (early-type) systems. The typical uncertainty on the data is shown in the lower left corner.
Current usage metrics show cumulative count of Article Views (full-text article views including HTML views, PDF and ePub downloads, according to the available data) and Abstracts Views on Vision4Press platform.
Data correspond to usage on the plateform after 2015. The current usage metrics is available 48-96 hours after online publication and is updated daily on week days.
Initial download of the metrics may take a while.