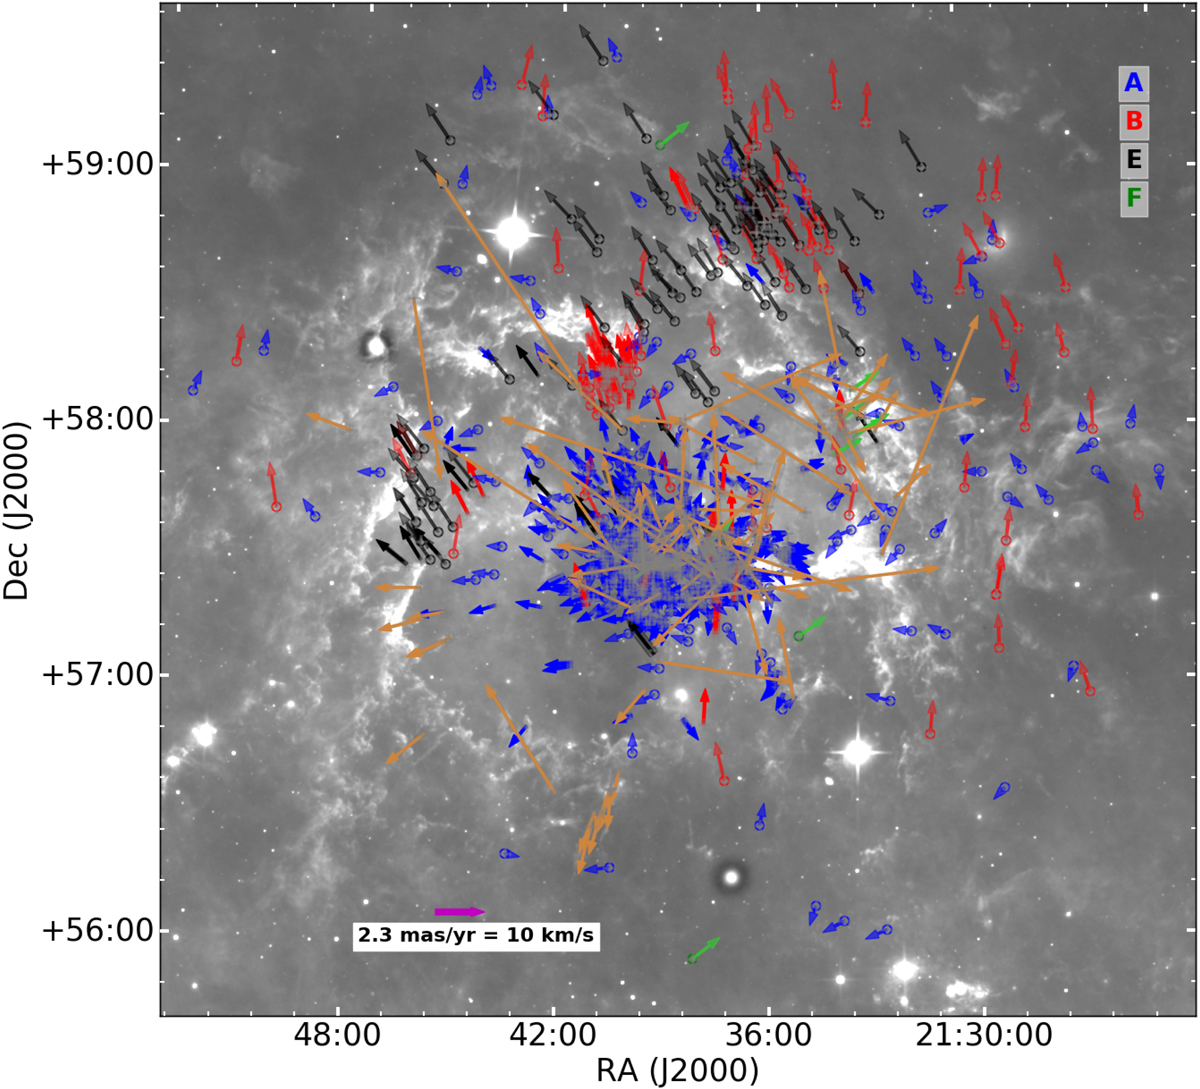
Fig. 9.
Download original image
Map of the velocity dispersion in proper motion of known and new members. The arrows mark the direction and size of the proper motion vectors relative to the average proper motions of subcluster A. They are color-coded by subcluster (see legend). Known members not associated with any subcluster are shown in orange. The long orange arrows are mostly from the extended population G. New members are marked by open circles. The magenta arrow in the bottom left corner indicates the physical velocity scale (at 925 pc).
Current usage metrics show cumulative count of Article Views (full-text article views including HTML views, PDF and ePub downloads, according to the available data) and Abstracts Views on Vision4Press platform.
Data correspond to usage on the plateform after 2015. The current usage metrics is available 48-96 hours after online publication and is updated daily on week days.
Initial download of the metrics may take a while.