Fig. 8.
Download original image
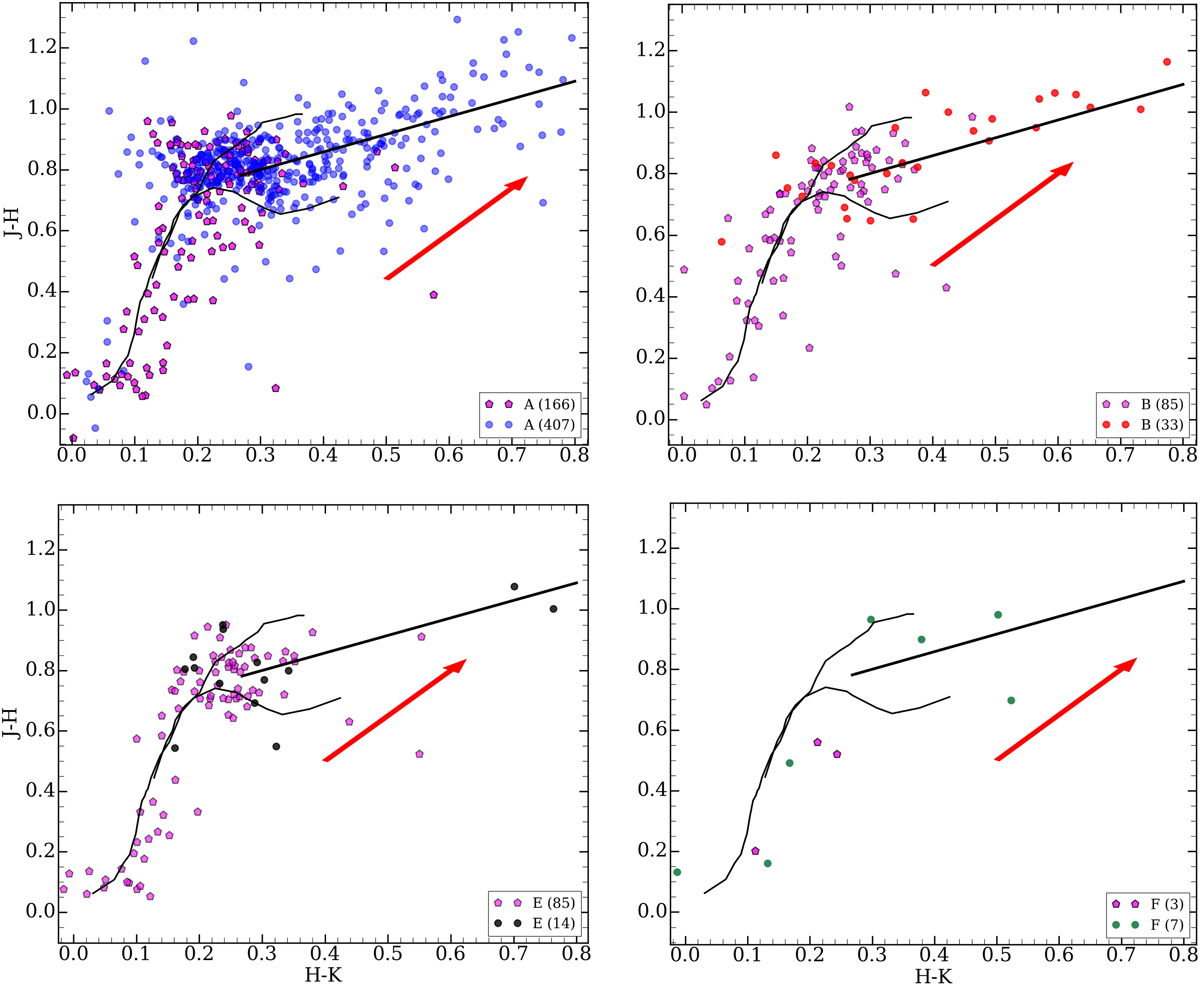
J − H vs. H − K diagrams for known members associated with the various subclusters obtained from the Maximum likelihood analysis (colored circles) and new members obtained from the Mahalanobis distance analysis (magenta pentagons). The number of sources with complete JHK photometry is indicated in the legend. Subclusters B and E include the new members with an intermediate probability of belonging to both subclusters. The MS and the giant branch are indicated by thin solid lines (Bessell & Brett 1988). The CTTS locus (Meyer et al. 1997) is indicated by a thick solid line. The theoretical tracks are corrected for extinction using the threshold AV = 1 mag. A reddening vector for AV = 3 mag is shown as a red arrow.
Current usage metrics show cumulative count of Article Views (full-text article views including HTML views, PDF and ePub downloads, according to the available data) and Abstracts Views on Vision4Press platform.
Data correspond to usage on the plateform after 2015. The current usage metrics is available 48-96 hours after online publication and is updated daily on week days.
Initial download of the metrics may take a while.