Fig. 7.
Download original image
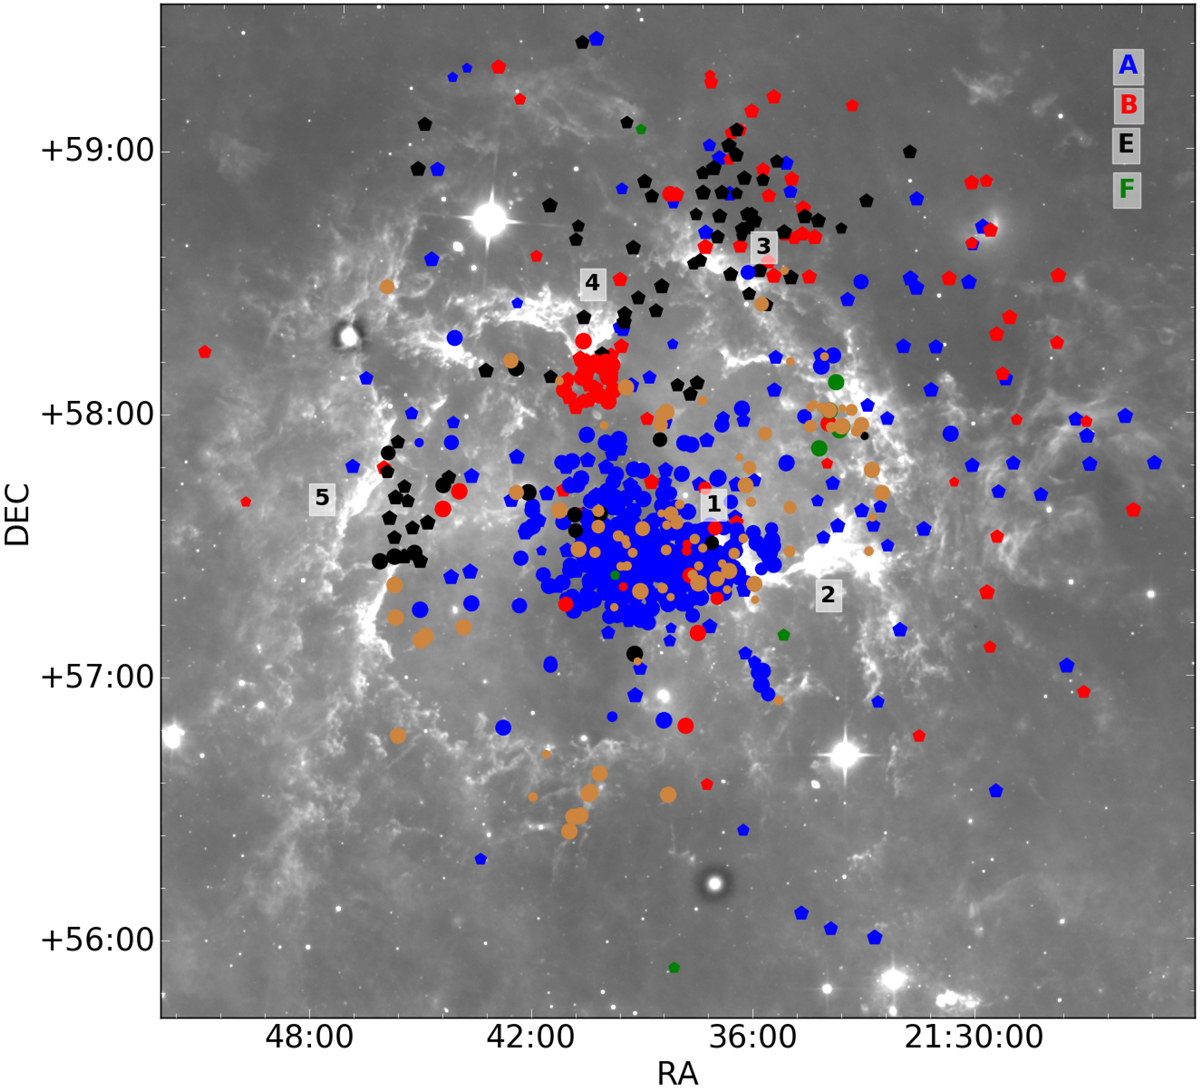
Spatial distribution of the known (full-color circles) and new (pentagon) members. The colors represent the four subclusters (A, B, E, F, see legend). Orange circles mark the rest of the known members not belonging to any subcluster. The age of members (derived in Sect. 5.1) is represented by the symbol sizes, with the youngest members having large symbols ranging from 0.1 to 20 Myr. Black numbers indicate the main BRCs, 1=IC1396 A, 2=IC1396 B, 3=IC1396 D, 4=IC1396 N, 5=IC1396 G. The background image is a ∼4° × ∼4° mosaic built from WISE 22.19 μm.
Current usage metrics show cumulative count of Article Views (full-text article views including HTML views, PDF and ePub downloads, according to the available data) and Abstracts Views on Vision4Press platform.
Data correspond to usage on the plateform after 2015. The current usage metrics is available 48-96 hours after online publication and is updated daily on week days.
Initial download of the metrics may take a while.