Fig. 5.

Download original image
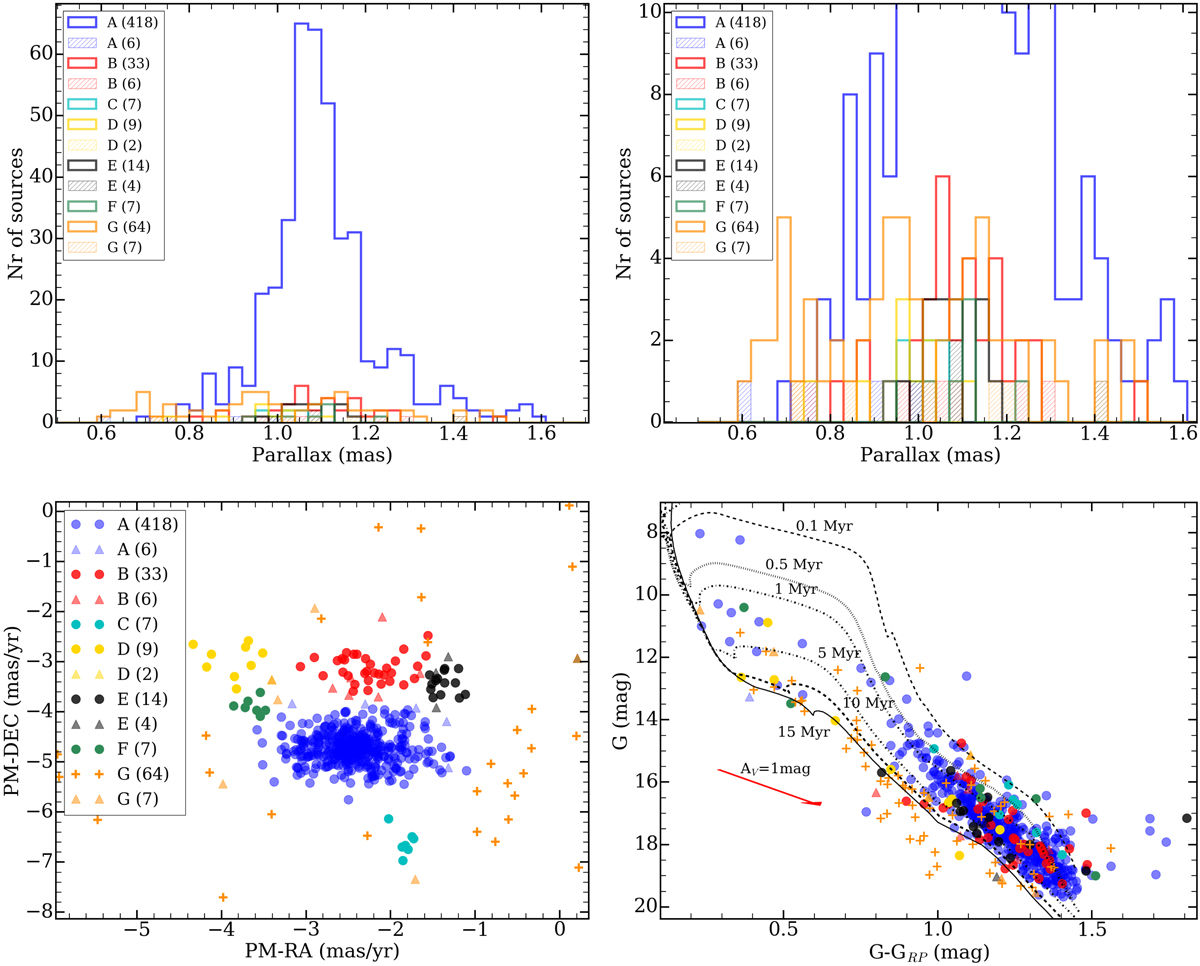
Parallax histogram (top, including the full histogram on the left and a zoom of the subclusters on the right), proper motion and color-magnitude diagram (bottom) of the known members of the subclusters found by the maximum likelihood analysis with the Gaia EDR3 data. The symbols and colors mark the various subclusters using circles, triangles, and capital letters (see legend). The number of subcluster members is given in parentheses. Full circles represent stars with a membership probability > 80%. Triangles represent objects with probabilities of < 80%. The theoretical PARSEC isochrones on the color-magnitude diagram have been corrected for a distance of 925 pc and a lower limit extinction AV = 1 mag to reject foreground stars. The extinction vector for 1 mag is indicated with a red arrow.
Current usage metrics show cumulative count of Article Views (full-text article views including HTML views, PDF and ePub downloads, according to the available data) and Abstracts Views on Vision4Press platform.
Data correspond to usage on the plateform after 2015. The current usage metrics is available 48-96 hours after online publication and is updated daily on week days.
Initial download of the metrics may take a while.


