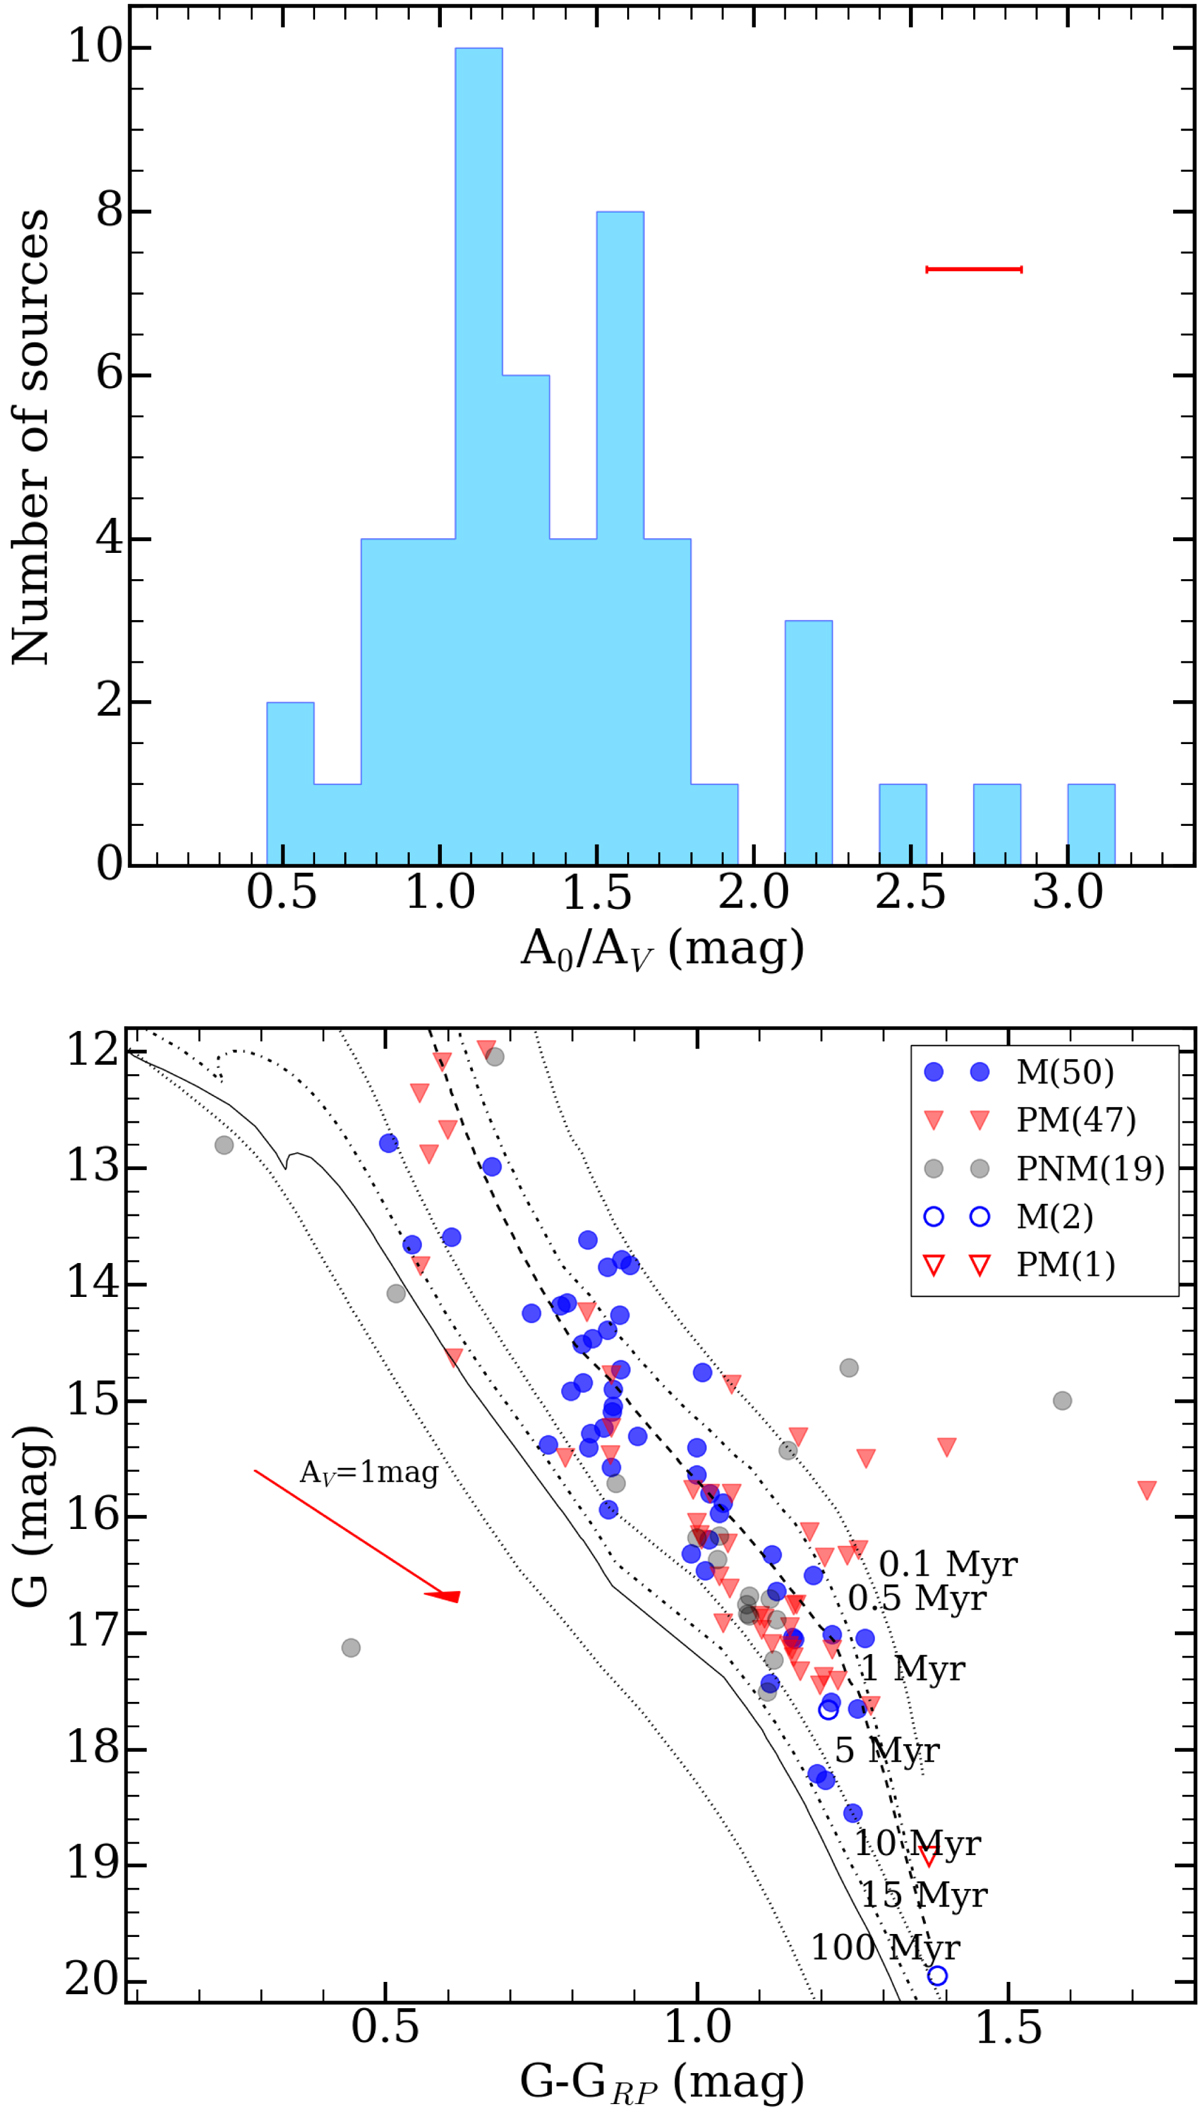
Fig. 3.
Download original image
Distribution of the extinction for the spectroscopically confirmed members (top). The mean error (0.3 mag) is shown with a red bar. Color-magnitude diagram for candidates with spectroscopic signatures of youth (bottom). Members (M) are marked by blue circles. Probable members (PM) are marked by red triangles. Probable non-members (PNM) are marked by gray circles. The number of objects in each class is also given. The magnitudes of each object are corrected by their individual extinction (full color symbols), except for objects with non-physical or uncertain extinctions, which have been corrected by cluster average extinction of 1.4 mag (open symbols). The PARSEC isochrones are corrected by the average distance of 925 pc.
Current usage metrics show cumulative count of Article Views (full-text article views including HTML views, PDF and ePub downloads, according to the available data) and Abstracts Views on Vision4Press platform.
Data correspond to usage on the plateform after 2015. The current usage metrics is available 48-96 hours after online publication and is updated daily on week days.
Initial download of the metrics may take a while.