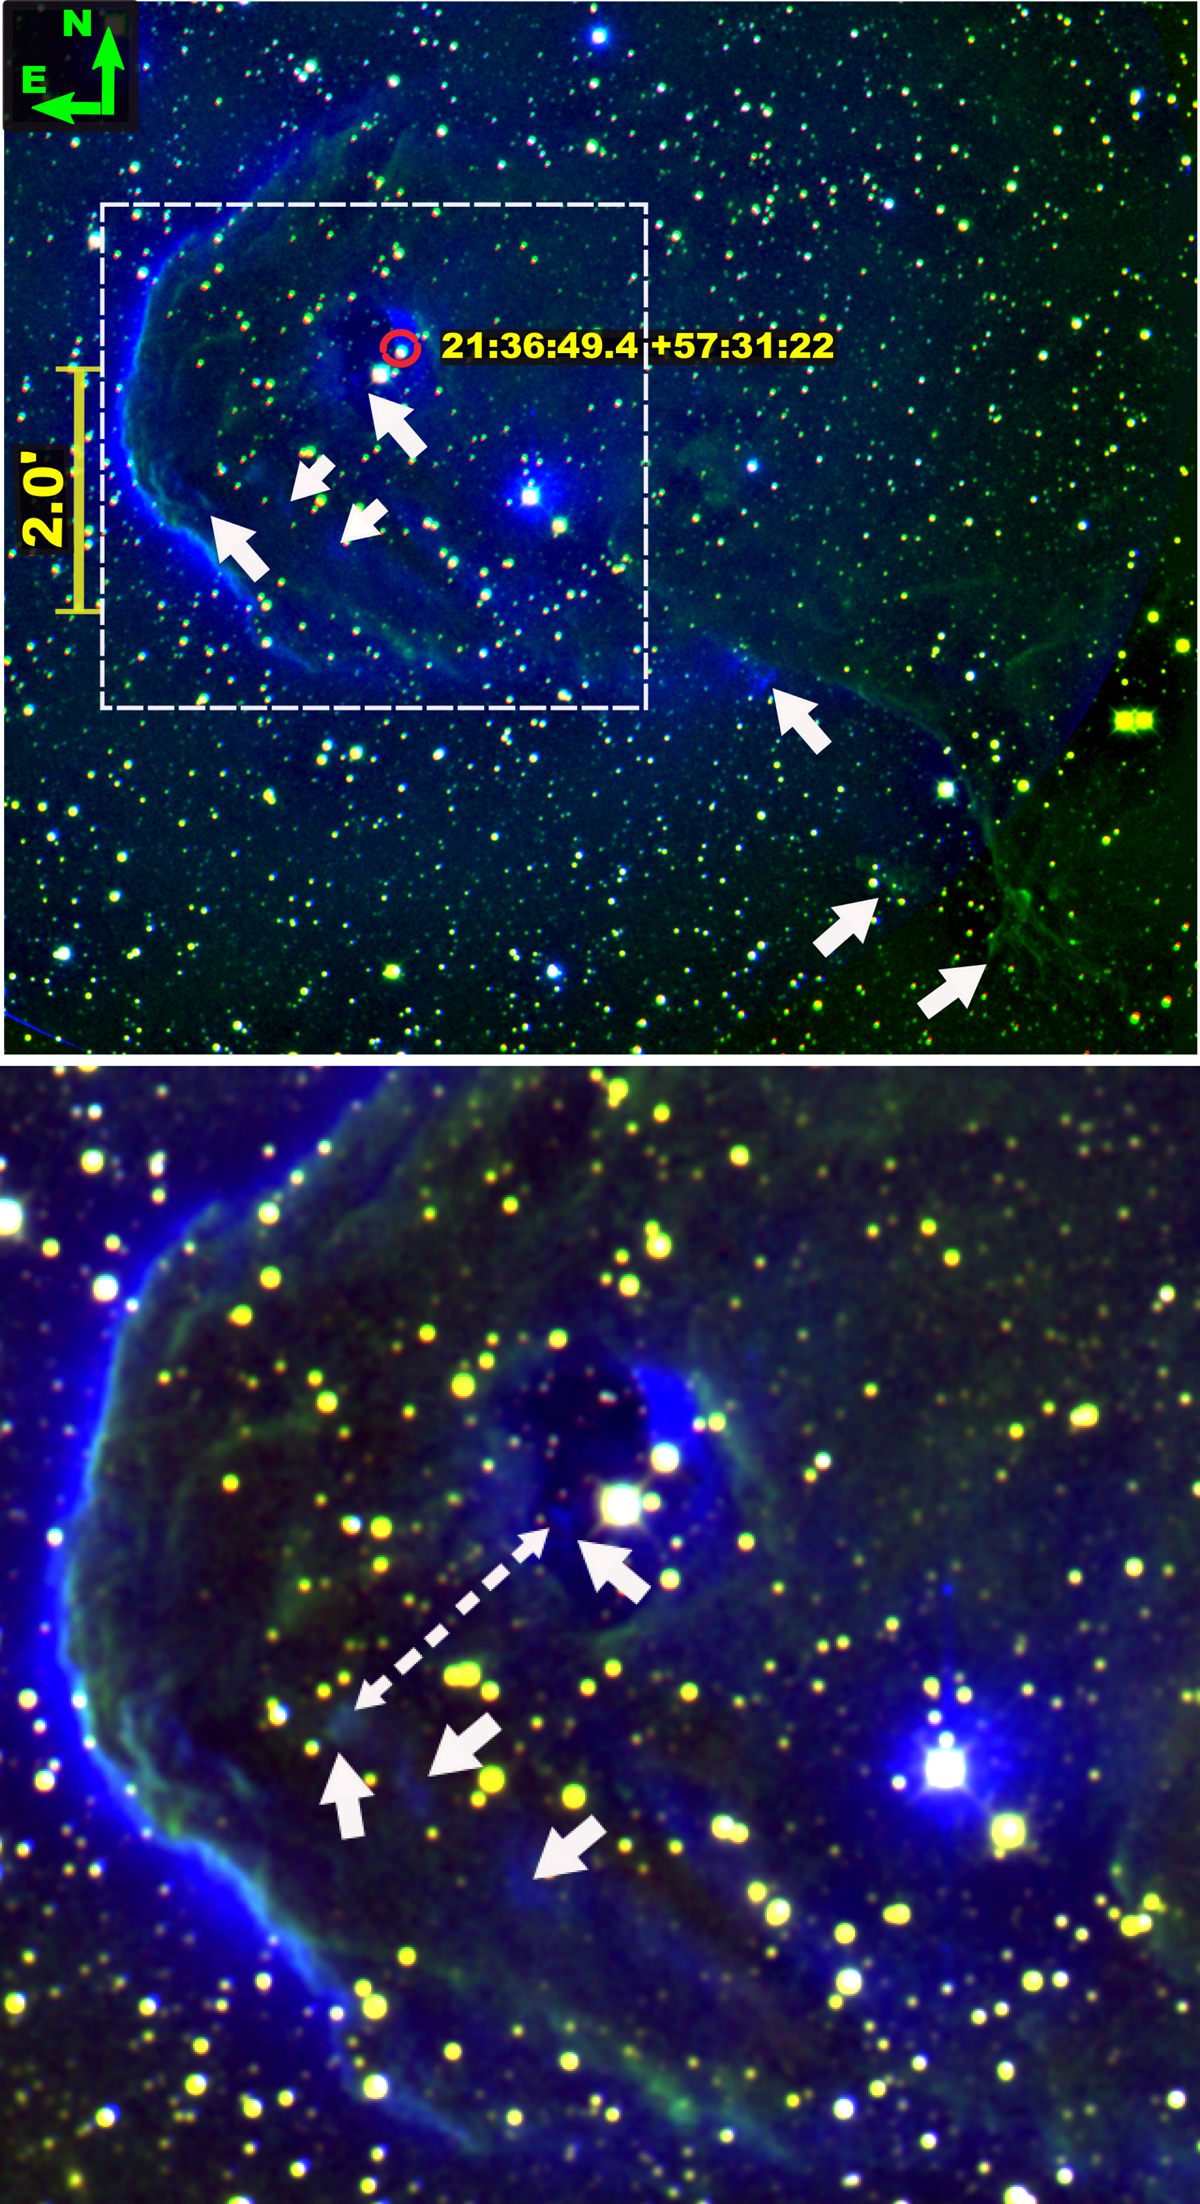
Fig. F.1.
Download original image
Three-color images (Ks, H2, and S[II] as red, green, and blue, respectively) of the BRCs. This figure shows IC1396A (top, zoomed on the bottom). The white dotted-line box is zoomed at the bottom. The shocks and knots are visible in H2 and S[II] as green and blue structures and marked with white arrows. Dotted white arrows show the trajectory of jets following the shocks or knots (see text Sect. 5.3). The remaining globules are shown in Figs. F.2 and F.3
Current usage metrics show cumulative count of Article Views (full-text article views including HTML views, PDF and ePub downloads, according to the available data) and Abstracts Views on Vision4Press platform.
Data correspond to usage on the plateform after 2015. The current usage metrics is available 48-96 hours after online publication and is updated daily on week days.
Initial download of the metrics may take a while.