Fig. 12.
Download original image
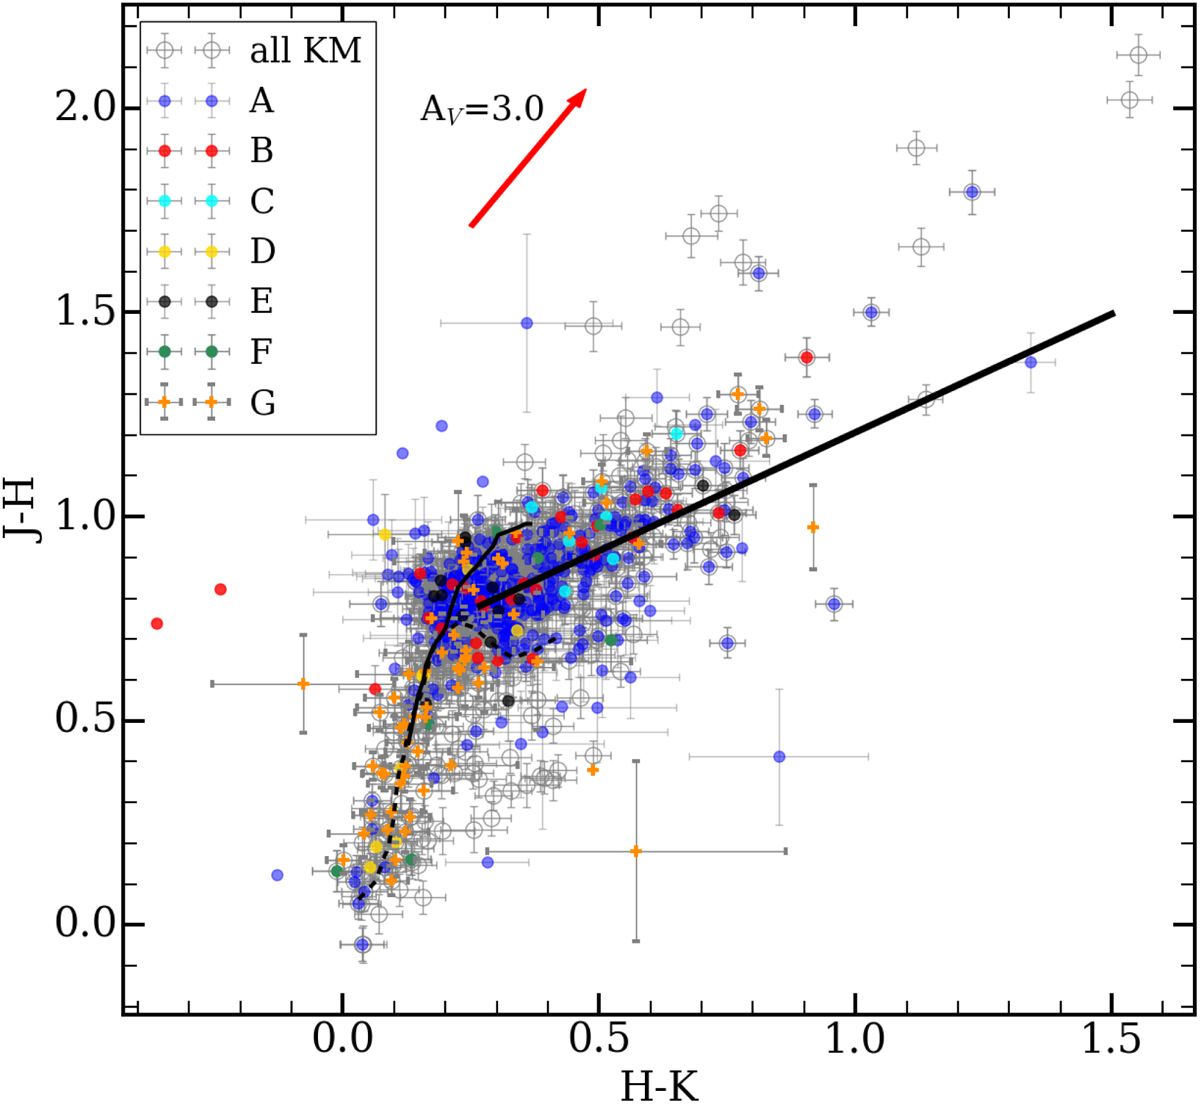
J − H vs. H − K diagram for all known members (KM) with magnitude uncertainties < 0.05 mag. The MS and the giant branch (Bessell & Brett 1988), as well as CTTS locus (Meyer et al. 1997), are indicated by a solid line. The theoretical tracks are corrected for extinction in JHKs (Cardelli et al. 1989), using the threshold AV = 1 mag. The extinction vector is indicated with a red arrow. KM in full color belong to the populations (A, B, C, D, E, F, and G) found from the maximum-likelihood analysis.
Current usage metrics show cumulative count of Article Views (full-text article views including HTML views, PDF and ePub downloads, according to the available data) and Abstracts Views on Vision4Press platform.
Data correspond to usage on the plateform after 2015. The current usage metrics is available 48-96 hours after online publication and is updated daily on week days.
Initial download of the metrics may take a while.