Fig. 10.
Download original image
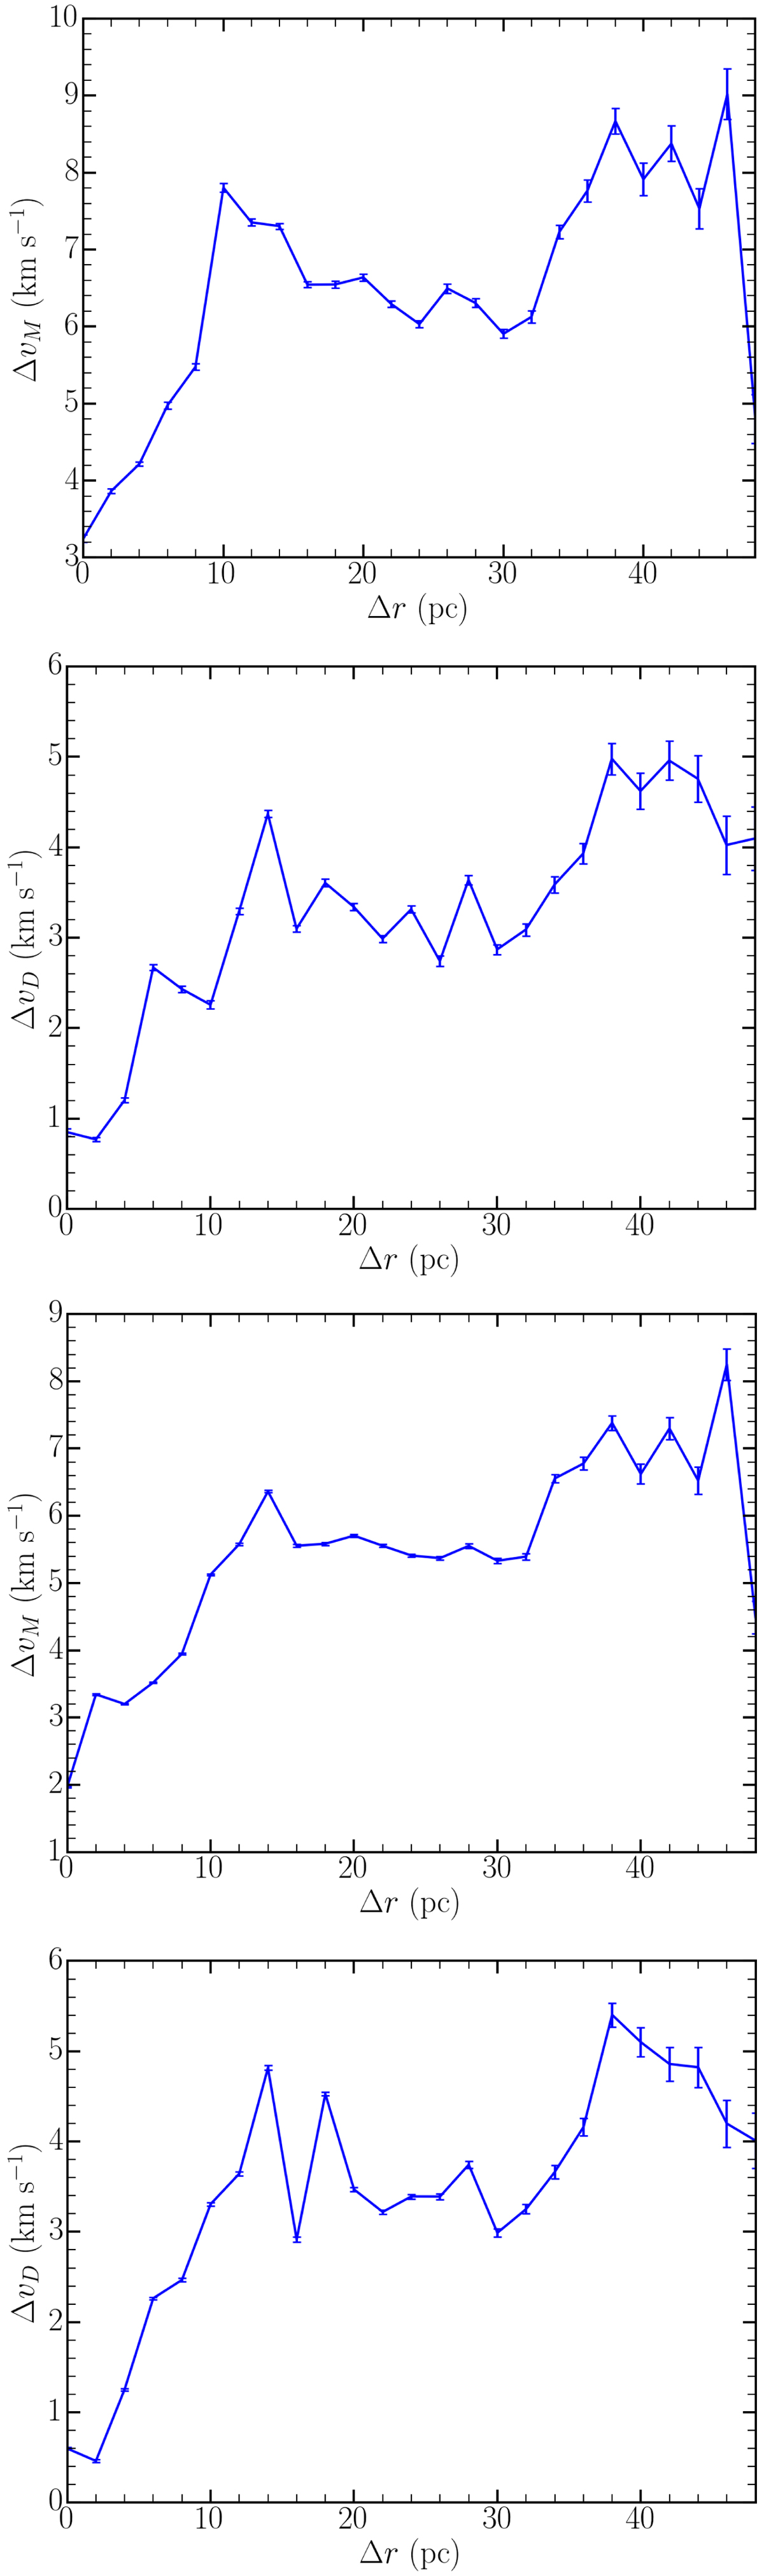
Velocity structure in the IC1396 region, shown in terms of the mean difference between the velocity magnitude ΔvM (left panels) and the directional velocity ΔvD (right panels) versus the difference distance in parsec (Δr; see text). The two top panels show the region velocity structure considering all known and new members, including the extended population (G), which has considerably larger velocities and velocity dispersion than the rest of clustered members. The two bottom panels include only the clustered part of the population, excluding subcluster G, and thus offer a better view of the evolution and dispersal of the clustered members.
Current usage metrics show cumulative count of Article Views (full-text article views including HTML views, PDF and ePub downloads, according to the available data) and Abstracts Views on Vision4Press platform.
Data correspond to usage on the plateform after 2015. The current usage metrics is available 48-96 hours after online publication and is updated daily on week days.
Initial download of the metrics may take a while.