Fig. 8.
Download original image
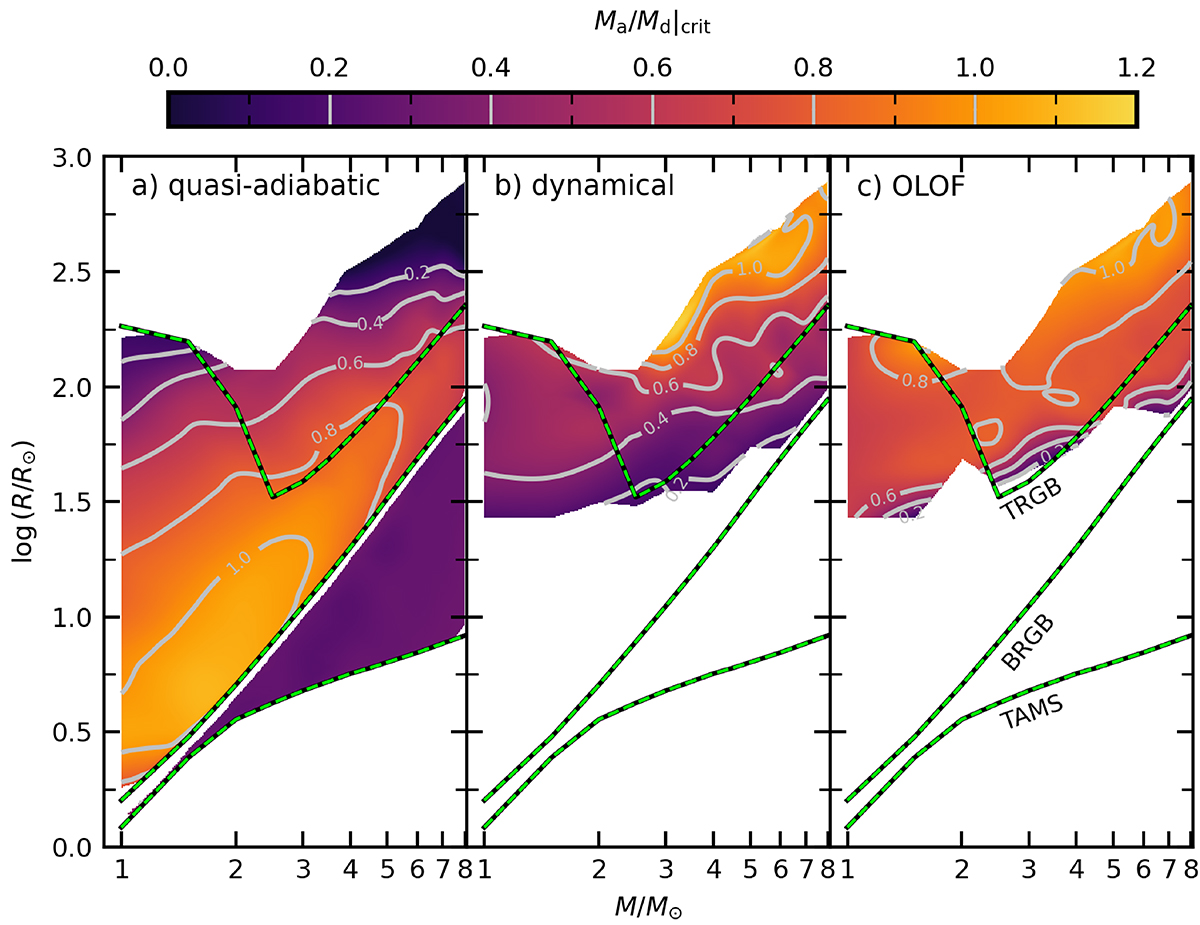
Critical mass ratios (qcrit, where q ≡ Ma/Md) for all our binary models as interpolated contours. The three panels show critical mass ratios derived using different criteria (outlined in Sect. 3), as indicated at the top of each panel. The colour shows the value of the critical mass ratio, following the colour bar at the top of the figure. The results shown in panel b are for Adyn = 0.05. The green dashed lines show the donor radii corresponding to the end of the main sequence (TAMS), the base of the RGB (BRGB), and the tip of the RGB (TRGB), from bottom to top.
Current usage metrics show cumulative count of Article Views (full-text article views including HTML views, PDF and ePub downloads, according to the available data) and Abstracts Views on Vision4Press platform.
Data correspond to usage on the plateform after 2015. The current usage metrics is available 48-96 hours after online publication and is updated daily on week days.
Initial download of the metrics may take a while.