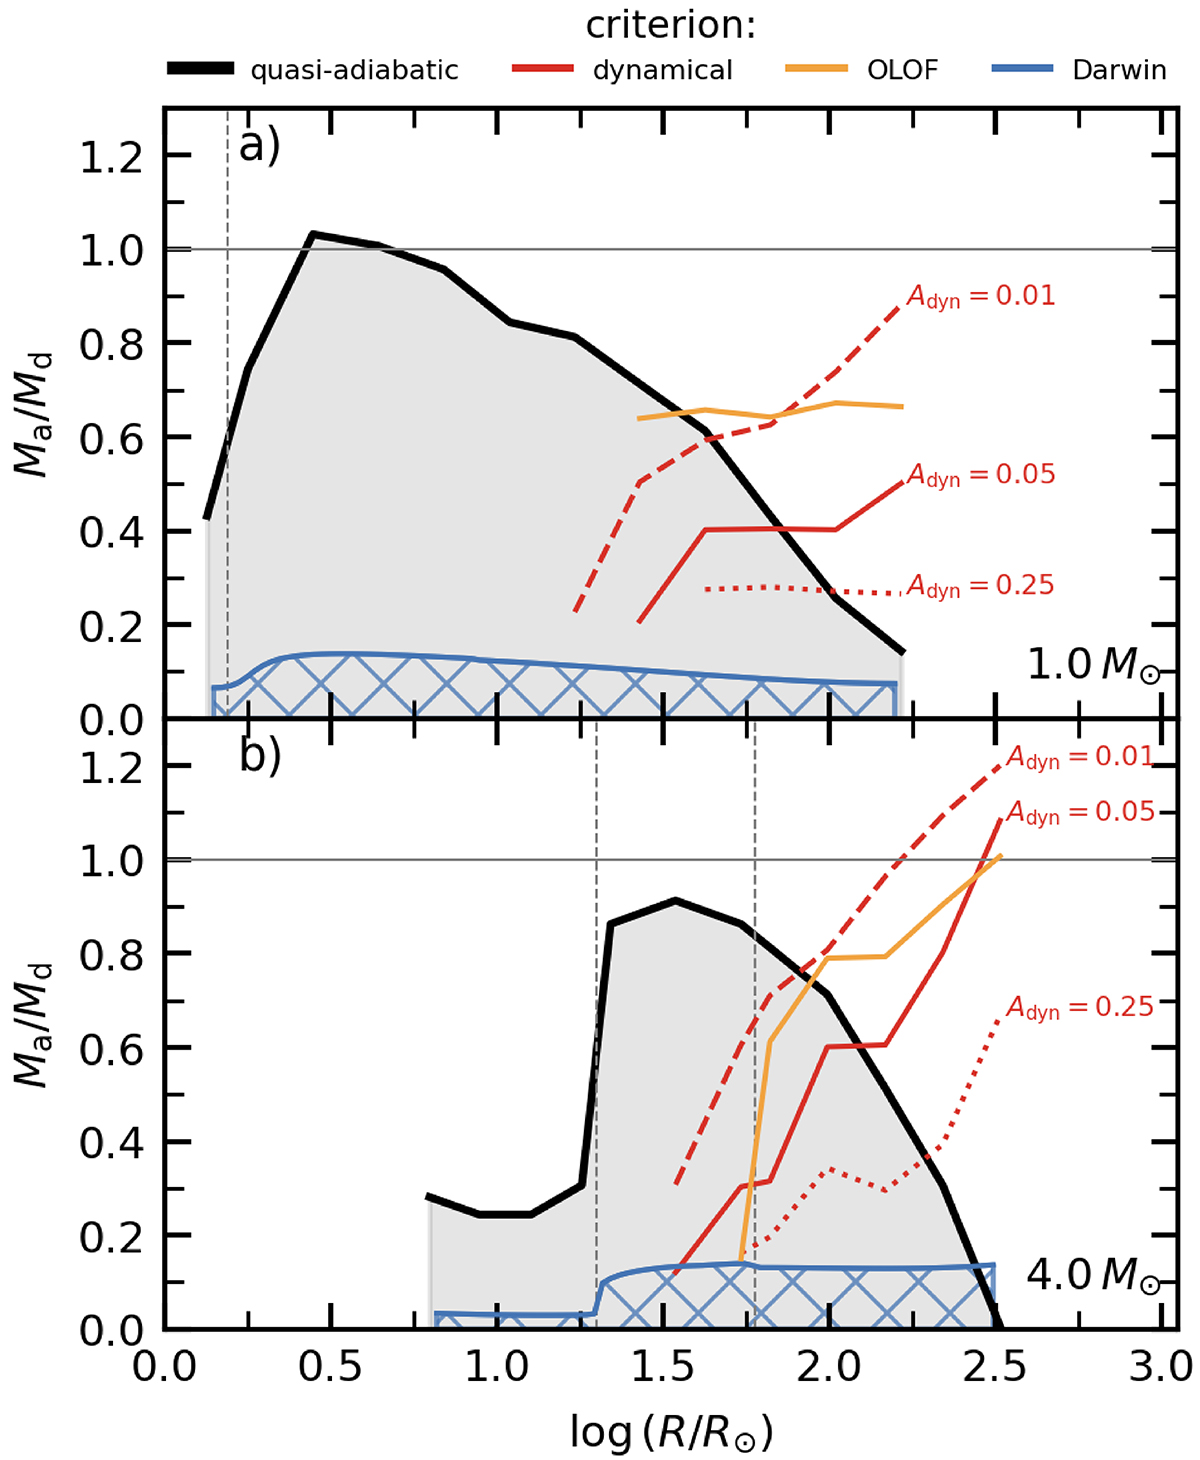
Fig. 7.
Download original image
Critical mass ratios (above which mass transfer is stable) for 1 M⊙ and 4 M⊙ donor stars as a function of donor radius, under different criteria for stable mass transfer (see Sect. 3). The solid black line shows the critical mass ratios resulting from our quasi-adiabatic criterion, with the grey shading indicating the parameter space where mass transfer would be unstable. The red lines show the critical mass ratios resulting from the dynamical evolution criterion with Adyn = 0.01, 0.05, 0.25, as indicated to the right end of the lines. The solid orange line shows the critical mass ratios resulting from the OLOF-based criterion, and the solid blue line and hatching show where the Darwin instability could be encountered (see Sect. 5.2). The solid horizontal grey line shows where Ma/Md = 1, and the dashed vertical grey lines show the end of the HG phase (panel a and left line in panel b) and the tip of the RGB (panel b).
Current usage metrics show cumulative count of Article Views (full-text article views including HTML views, PDF and ePub downloads, according to the available data) and Abstracts Views on Vision4Press platform.
Data correspond to usage on the plateform after 2015. The current usage metrics is available 48-96 hours after online publication and is updated daily on week days.
Initial download of the metrics may take a while.