Fig. 6.
Download original image
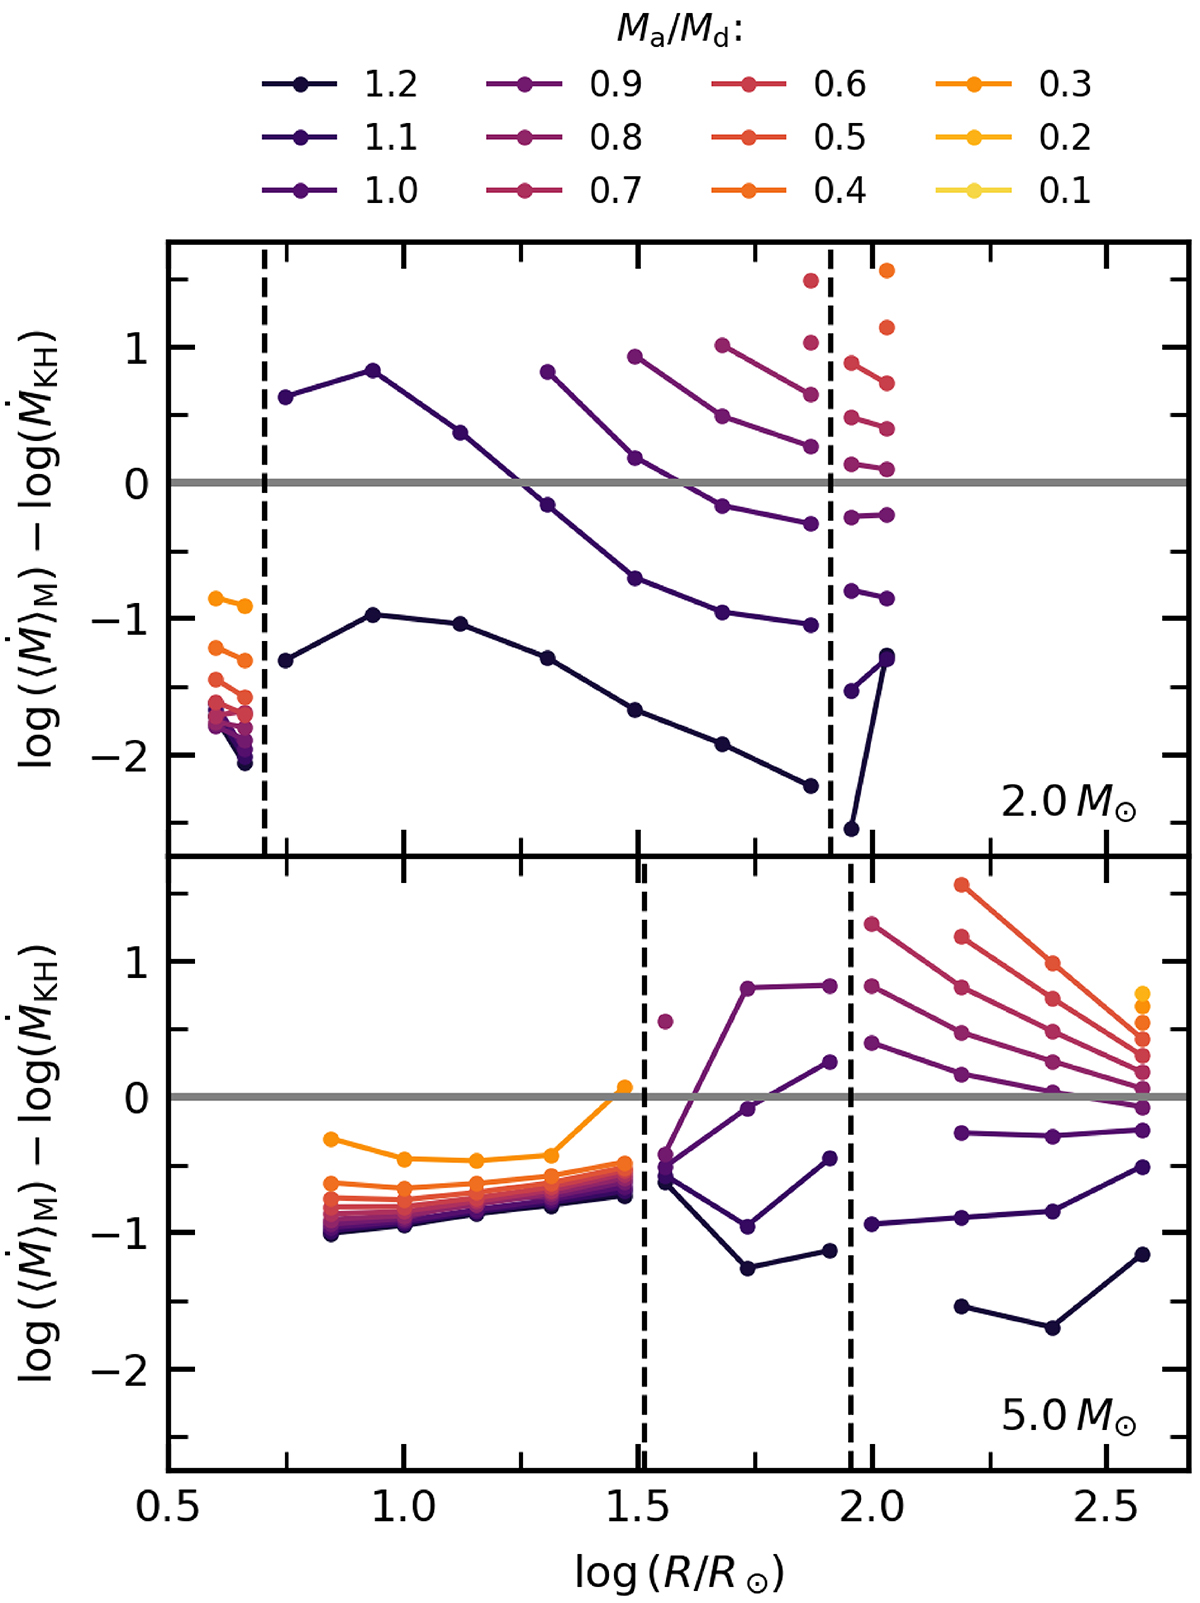
Mass-transfer rates from our calculations compared to the global KH rate (as given by Eq. (6)). The top panel shows results for a 2 M⊙ donor star, whilst the bottom panel shows results for a 5 M⊙ donor star. In each panel, the coloured lines show the difference between the mass-transfer rate predicted by Eq. (6), (which assumes the rate is governed by the global KH timescale at the onset of mass transfer) and the mass-averaged mass-loss rate ⟨Ṁd⟩M (see Eq. (10)) from our calculations. Vertical dashed black lines indicate the base and the tip of the RGB.
Current usage metrics show cumulative count of Article Views (full-text article views including HTML views, PDF and ePub downloads, according to the available data) and Abstracts Views on Vision4Press platform.
Data correspond to usage on the plateform after 2015. The current usage metrics is available 48-96 hours after online publication and is updated daily on week days.
Initial download of the metrics may take a while.