Fig. 5.
Download original image
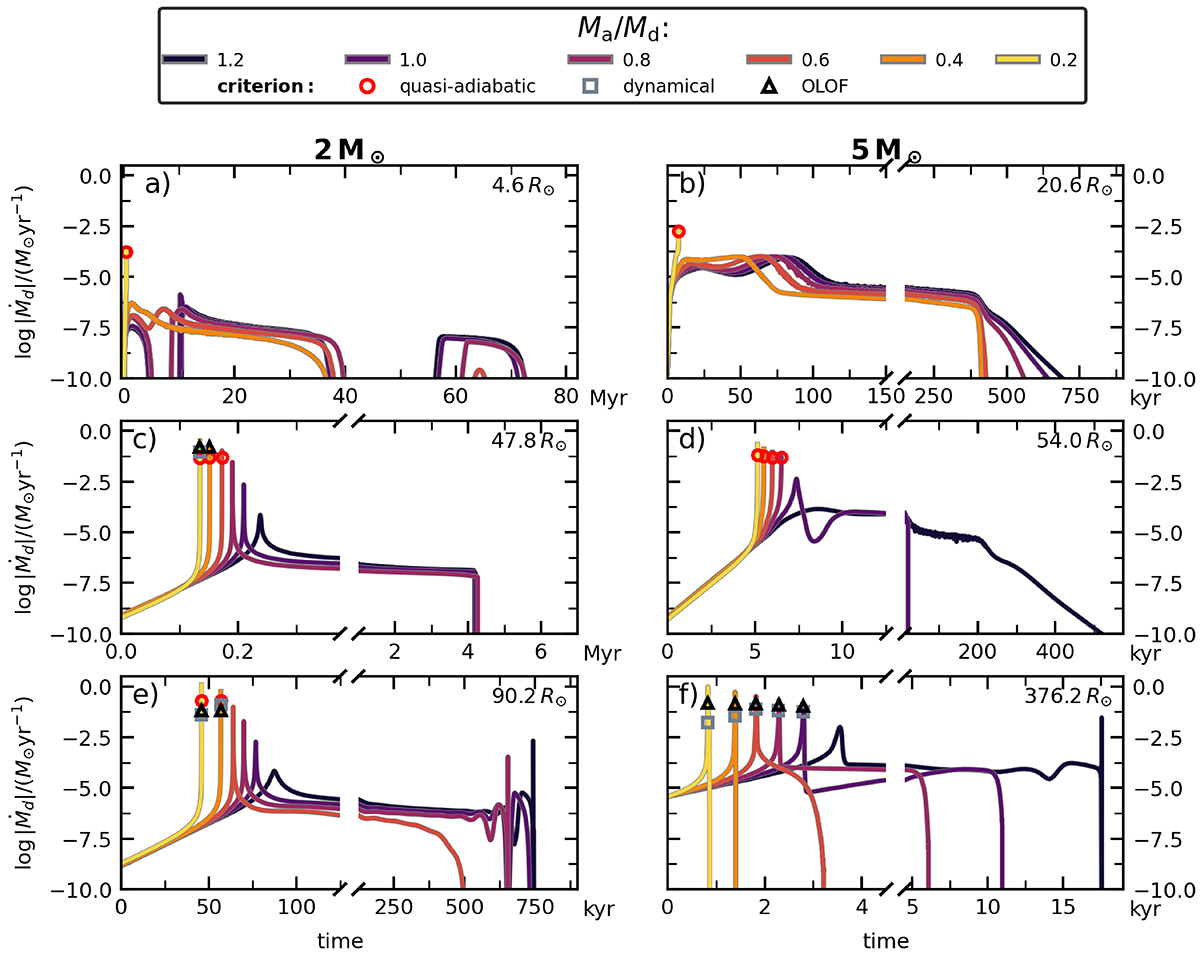
Time evolution of mass-transfer rates in systems with Md = 2 M⊙ (left column) and Md = 5 M⊙ (right column). Each row corresponds to RLOF starting in a different phase of the donor stars’ lives (at the radius indicated in the top right of each panel). More specifically, panels a and b show HG donors, panels c and d show donors on their RGB, and panels e and f show donors on their AGB. The colours of the lines correspond to different mass ratios at the onset of RLOF, as indicated in the legend. We have indicated where, if appropriate, our quasi-adiabatic-, dynamical-, and OLOF-based criteria are met with open circles, squares, and triangles, respectively. The zero point of the time axis is defined as the first moment when the mass-transfer rate exceeds the rate at which wind mass loss occurs.
Current usage metrics show cumulative count of Article Views (full-text article views including HTML views, PDF and ePub downloads, according to the available data) and Abstracts Views on Vision4Press platform.
Data correspond to usage on the plateform after 2015. The current usage metrics is available 48-96 hours after online publication and is updated daily on week days.
Initial download of the metrics may take a while.