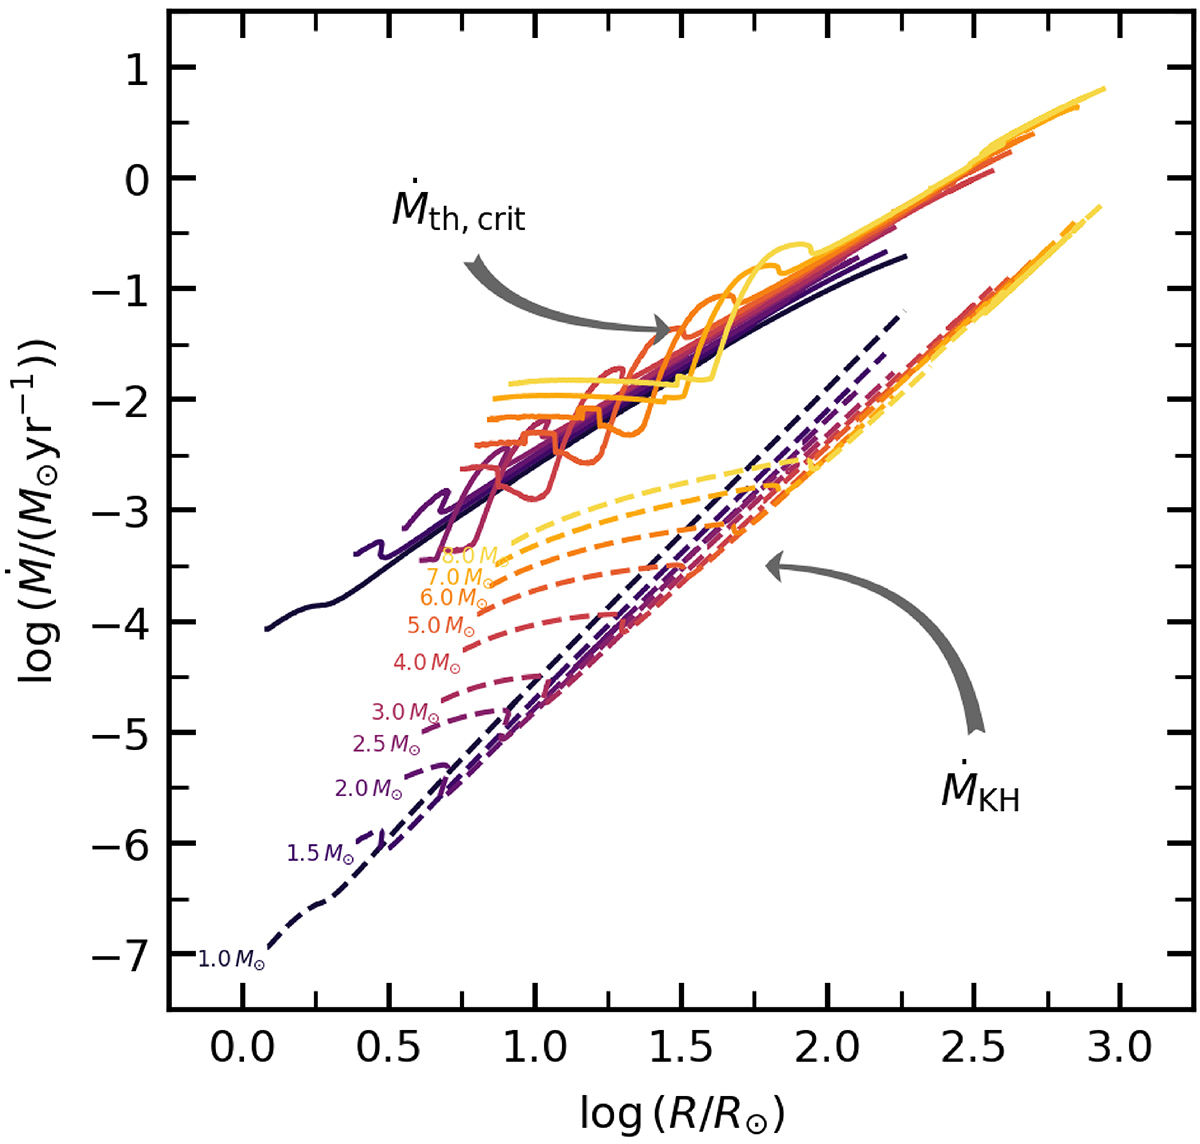
Fig. 4.
Download original image
Critical mass-loss rate as a function of stellar radius from thermal considerations (see Eq. (9)). Solid lines show the critical mass-loss rate based on local thermal properties of the sub-surface layers of the donor star (see Eq. (8) and Fig. 3), whilst dashed lines show the critical mass-loss rate based on global thermal properties (see Eq. (6)). The linear portions of the curves correspond to the giant phases. The colours of the lines correspond to different initial donor masses, as indicated to the lower left of each dashed line.
Current usage metrics show cumulative count of Article Views (full-text article views including HTML views, PDF and ePub downloads, according to the available data) and Abstracts Views on Vision4Press platform.
Data correspond to usage on the plateform after 2015. The current usage metrics is available 48-96 hours after online publication and is updated daily on week days.
Initial download of the metrics may take a while.