Fig. 3.
Download original image
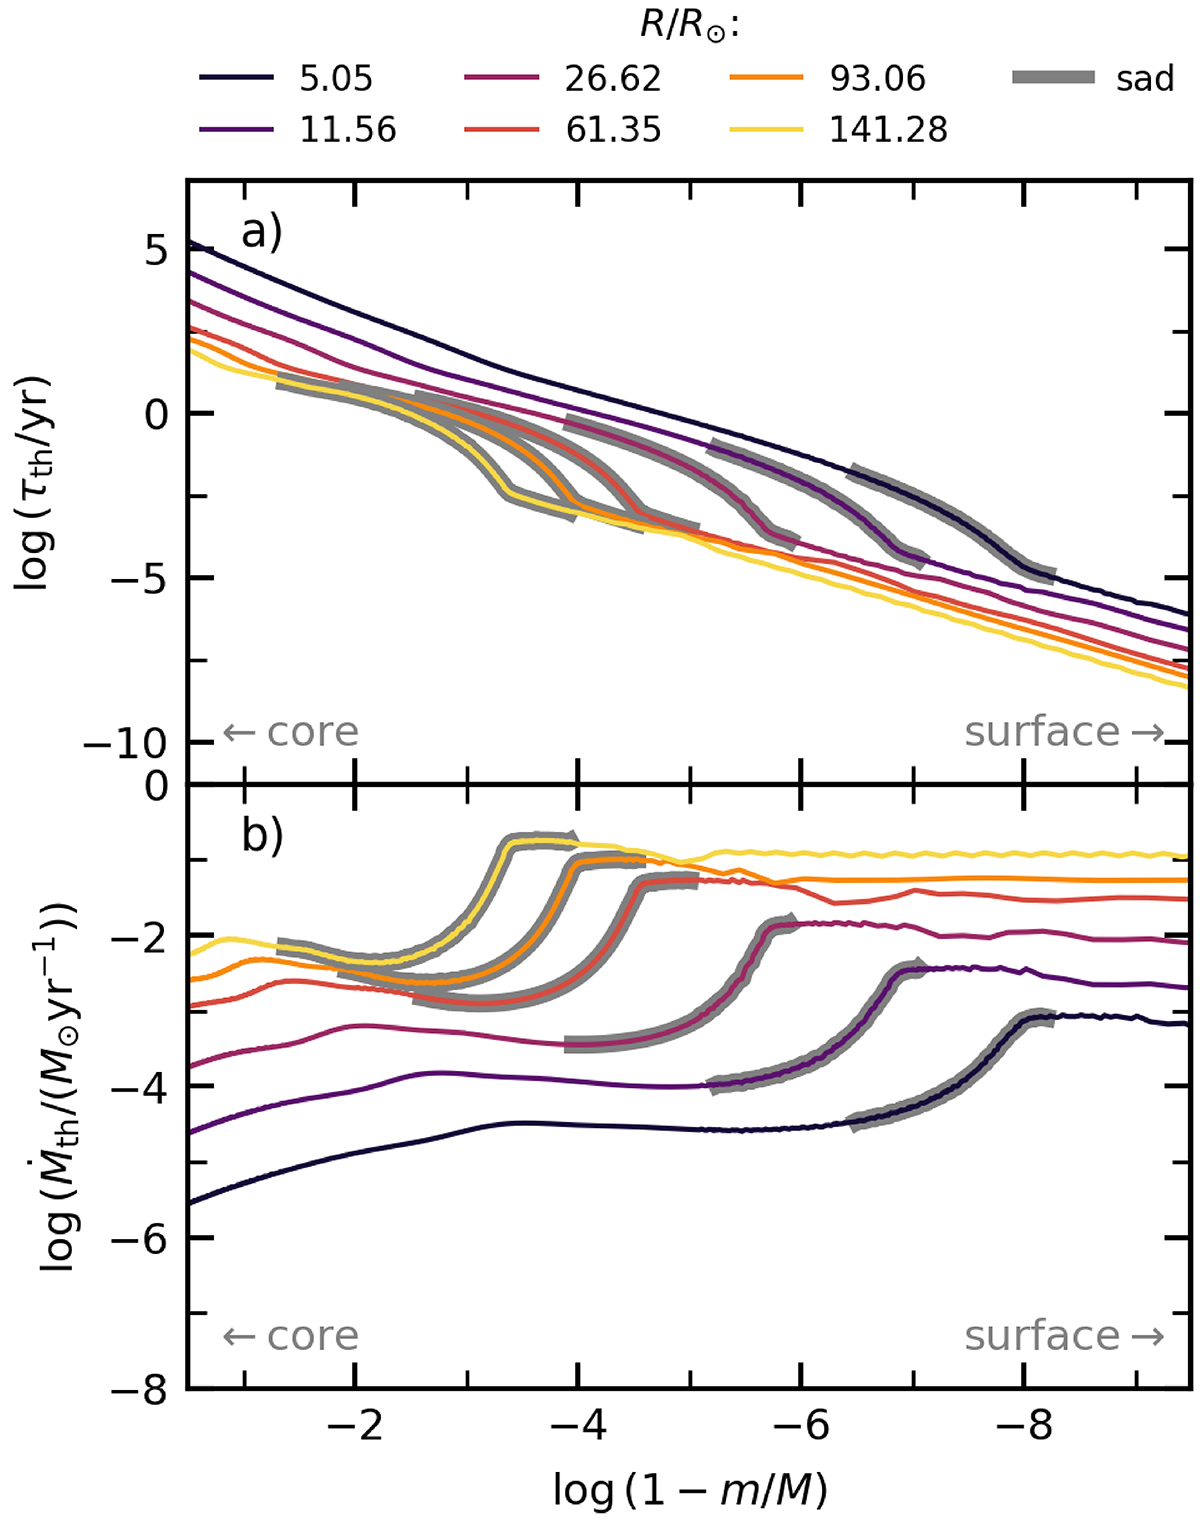
Thermal properties of a 1.5 M⊙ donor star at various stages in its post-MS evolution. The colours of the lines correspond to the moments the star reaches certain radii (as shown in Fig. 1), whose values are shown in the legend. Regions with grey shading are significantly superadiabatic (‘sad’; here defined as regions where ∇ − ∇ad ≥ 0.1∇; with ![]() ). The top panel shows the run of the local thermal timescale (see Eq. (7)) with the logarithm of the fractional exterior mass, such that the stellar centre is located on the left end of the x axis, and the surface is located to the right. The bottom panel shows the run of the associated thermal mass-loss rate (see Eq. (8)) on the same horizontal axis.
). The top panel shows the run of the local thermal timescale (see Eq. (7)) with the logarithm of the fractional exterior mass, such that the stellar centre is located on the left end of the x axis, and the surface is located to the right. The bottom panel shows the run of the associated thermal mass-loss rate (see Eq. (8)) on the same horizontal axis.
Current usage metrics show cumulative count of Article Views (full-text article views including HTML views, PDF and ePub downloads, according to the available data) and Abstracts Views on Vision4Press platform.
Data correspond to usage on the plateform after 2015. The current usage metrics is available 48-96 hours after online publication and is updated daily on week days.
Initial download of the metrics may take a while.