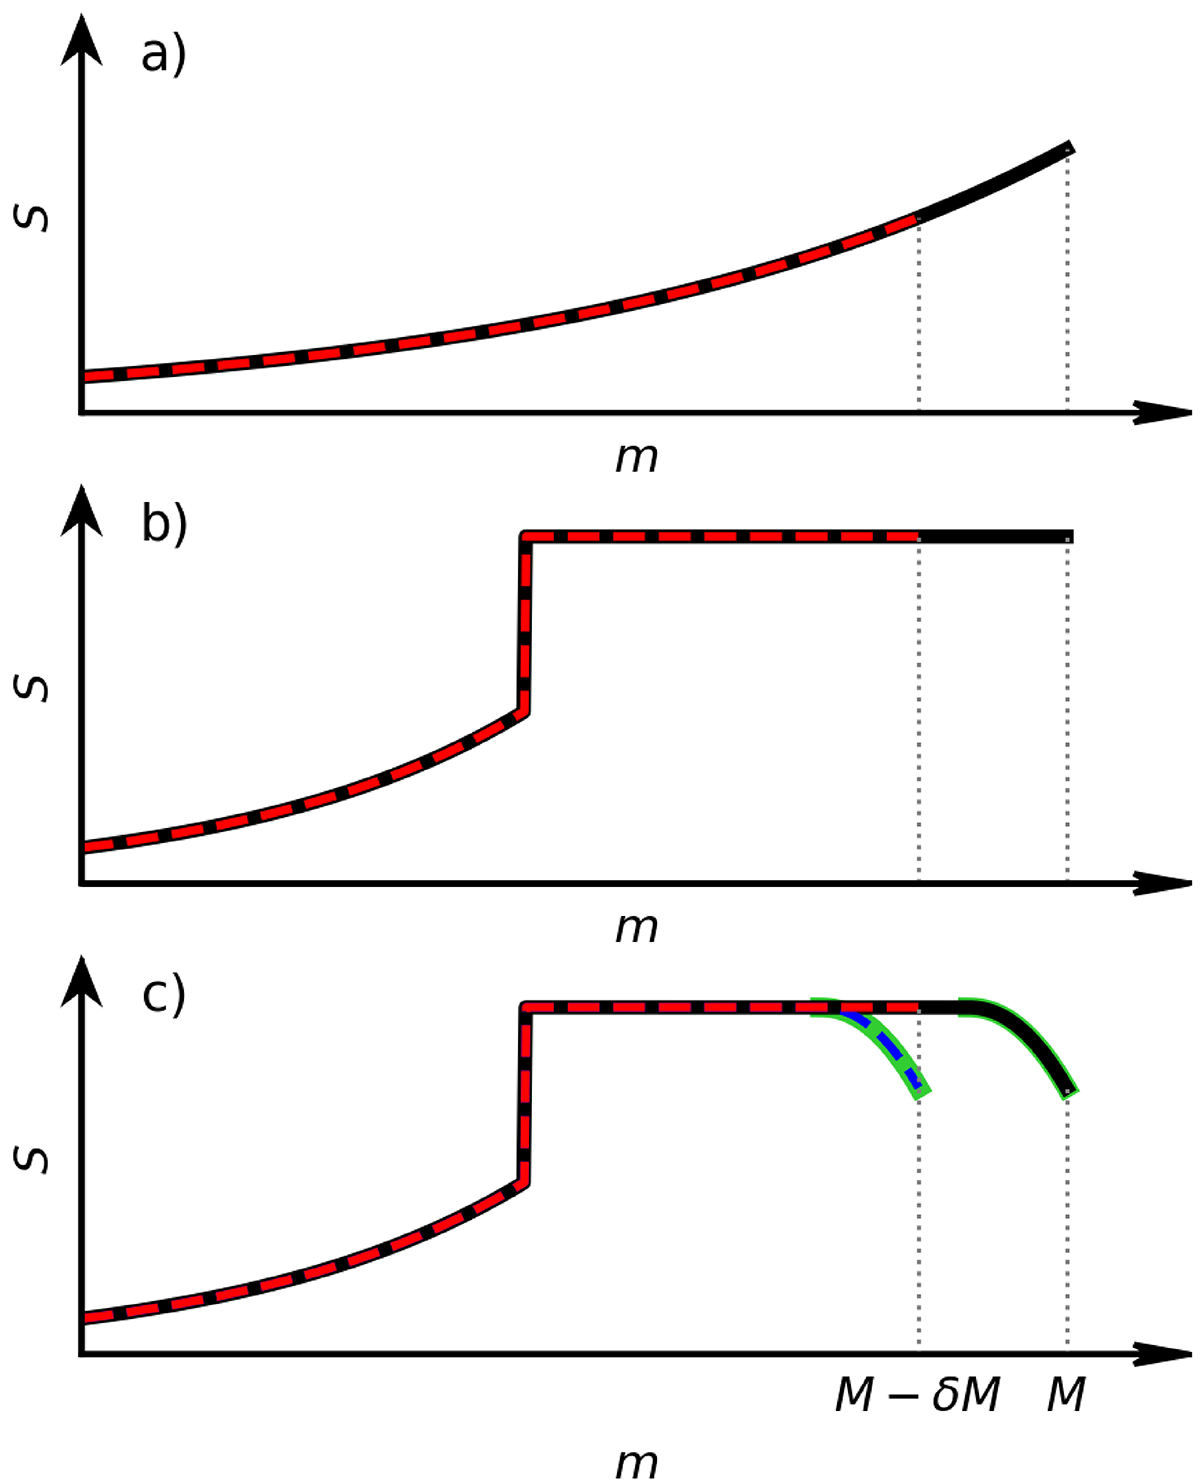
Fig. 2.
Download original image
Schematic illustration of the entropy (S) profile versus mass coordinate m in various types of stars. Panel a depicts a representation of a star with a radiative envelope, whilst panel b shows a model for a giant with a convective, isentropic envelope. A more realistic representation of the envelope of a convective giant is shown in panel c, which includes the superadiabatic sub-surface layers (highlighted in green). In each panel, the black line represents the entropy profile of the undisturbed star. Dashed red lines represent the entropy profile after sudden adiabatic (see text) loss of ΔM of mass. The dashed blue line in panel c shows the entropy profile if the mass is lost at a rate below the critical mass-loss rate (Eq. (9)).
Current usage metrics show cumulative count of Article Views (full-text article views including HTML views, PDF and ePub downloads, according to the available data) and Abstracts Views on Vision4Press platform.
Data correspond to usage on the plateform after 2015. The current usage metrics is available 48-96 hours after online publication and is updated daily on week days.
Initial download of the metrics may take a while.