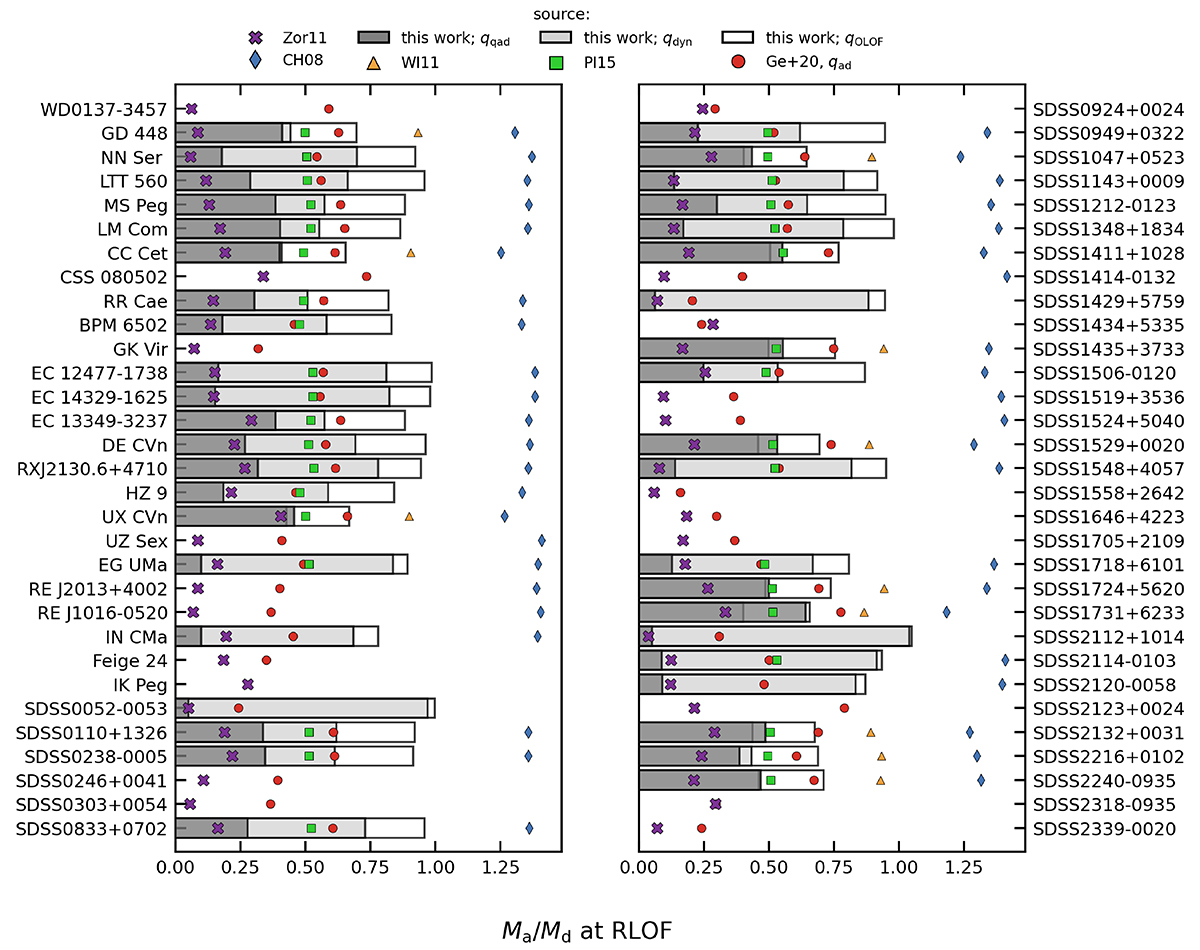
Fig. 10.
Download original image
Comparison of our results to observationally derived mass ratios. The purple ‘x’ markers indicate mass ratios of systems at the onset of mass transfer, inferred from observations of post-CE binaries. Different shades of grey show mass ratio ranges leading to unstable mass transfer based on the different criteria studied in this work, as indicated in the legend, interpolated to the properties of each system. The coloured symbols correspond to interpolated critical mass ratios based on results from a variety of sources, as indicated in the legend using the same abbreviations for literature sources as in the text and as used in Fig. 9.
Current usage metrics show cumulative count of Article Views (full-text article views including HTML views, PDF and ePub downloads, according to the available data) and Abstracts Views on Vision4Press platform.
Data correspond to usage on the plateform after 2015. The current usage metrics is available 48-96 hours after online publication and is updated daily on week days.
Initial download of the metrics may take a while.