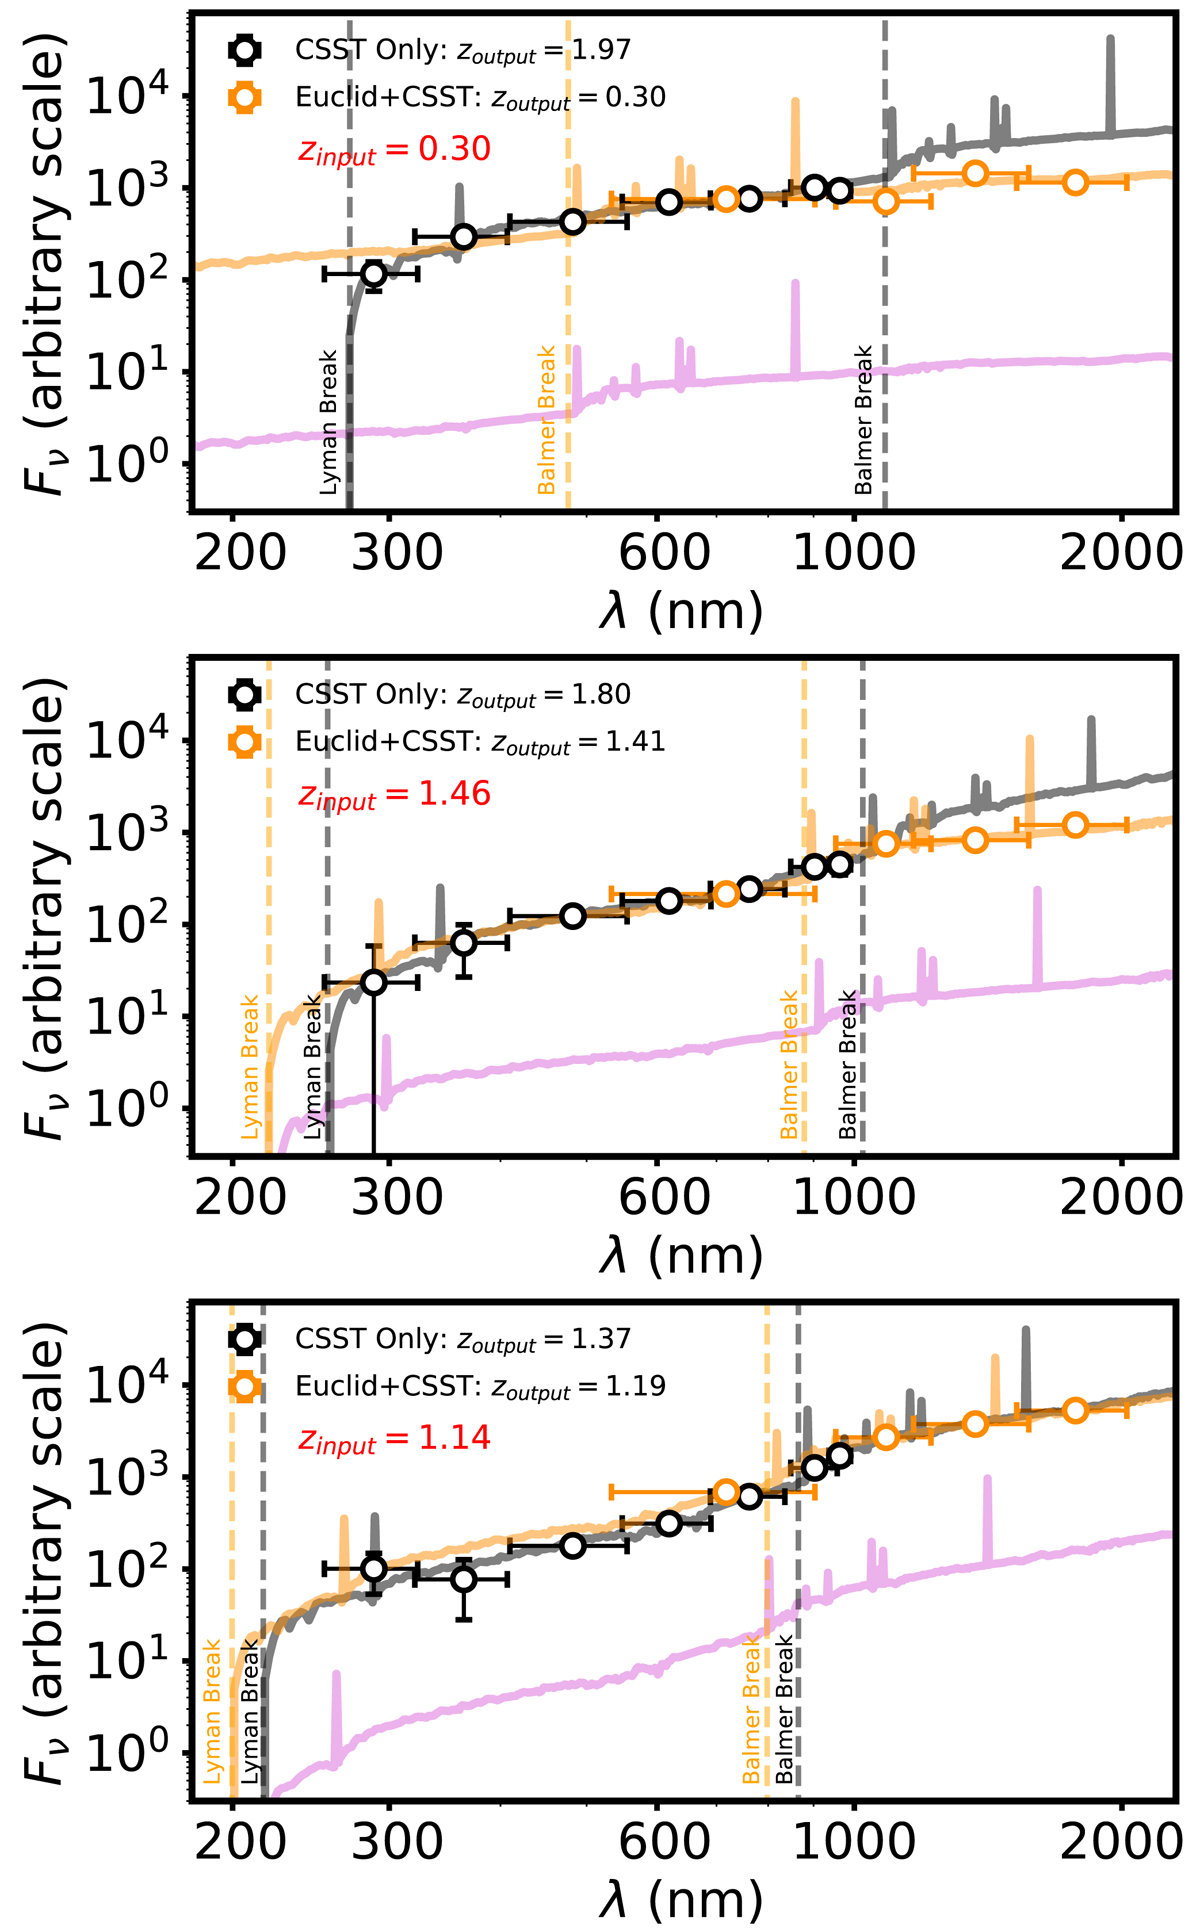
Fig. 7.
Download original image
Three examples illustrating the best-fit SEDs and photo-zs in the case of CSST-only (black) and that in Euclid+CSST (orange). The original SEDs of the galaxies (purple) are shifted down for clarity. In each panel, the vertical black and orange dashed lines from left to right indicate the Lyman break and Balmer break of the best-fit SED from the CSST-only and the Euclid+CSST setups, respectively. The black and orange dots represent the fluxes of CSST and Euclid bands, respectively. The error bar of each dot along the horizontal axis represents the FWHM of that band, while the error bar along the vertical axis represents the photometric error.
Current usage metrics show cumulative count of Article Views (full-text article views including HTML views, PDF and ePub downloads, according to the available data) and Abstracts Views on Vision4Press platform.
Data correspond to usage on the plateform after 2015. The current usage metrics is available 48-96 hours after online publication and is updated daily on week days.
Initial download of the metrics may take a while.