Fig. 15.
Download original image
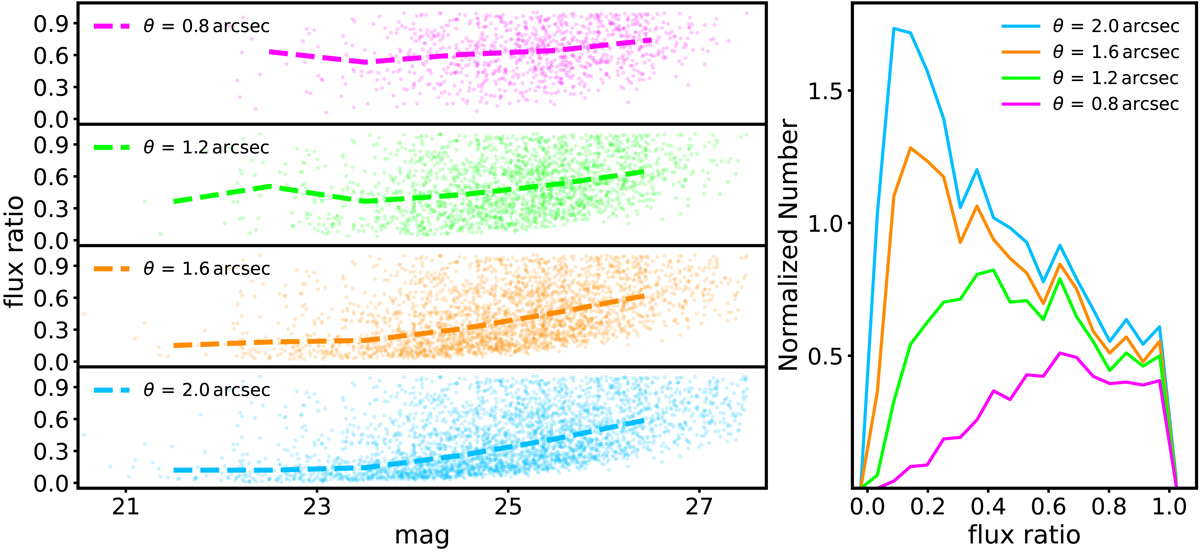
Flux ratio of the contributing Euclid VIS I1 galaxies in the LSST-like total blends. The sub-panels in the left panel show the scatters and the median values of the flux ratios with different matching radii with the horizontal axis showing the LSST-like r-band magnitude of the total blends. The right panel is the corresponding results of the probability distributions normalized using the number of total blends for a matching radius of 2″.
Current usage metrics show cumulative count of Article Views (full-text article views including HTML views, PDF and ePub downloads, according to the available data) and Abstracts Views on Vision4Press platform.
Data correspond to usage on the plateform after 2015. The current usage metrics is available 48-96 hours after online publication and is updated daily on week days.
Initial download of the metrics may take a while.