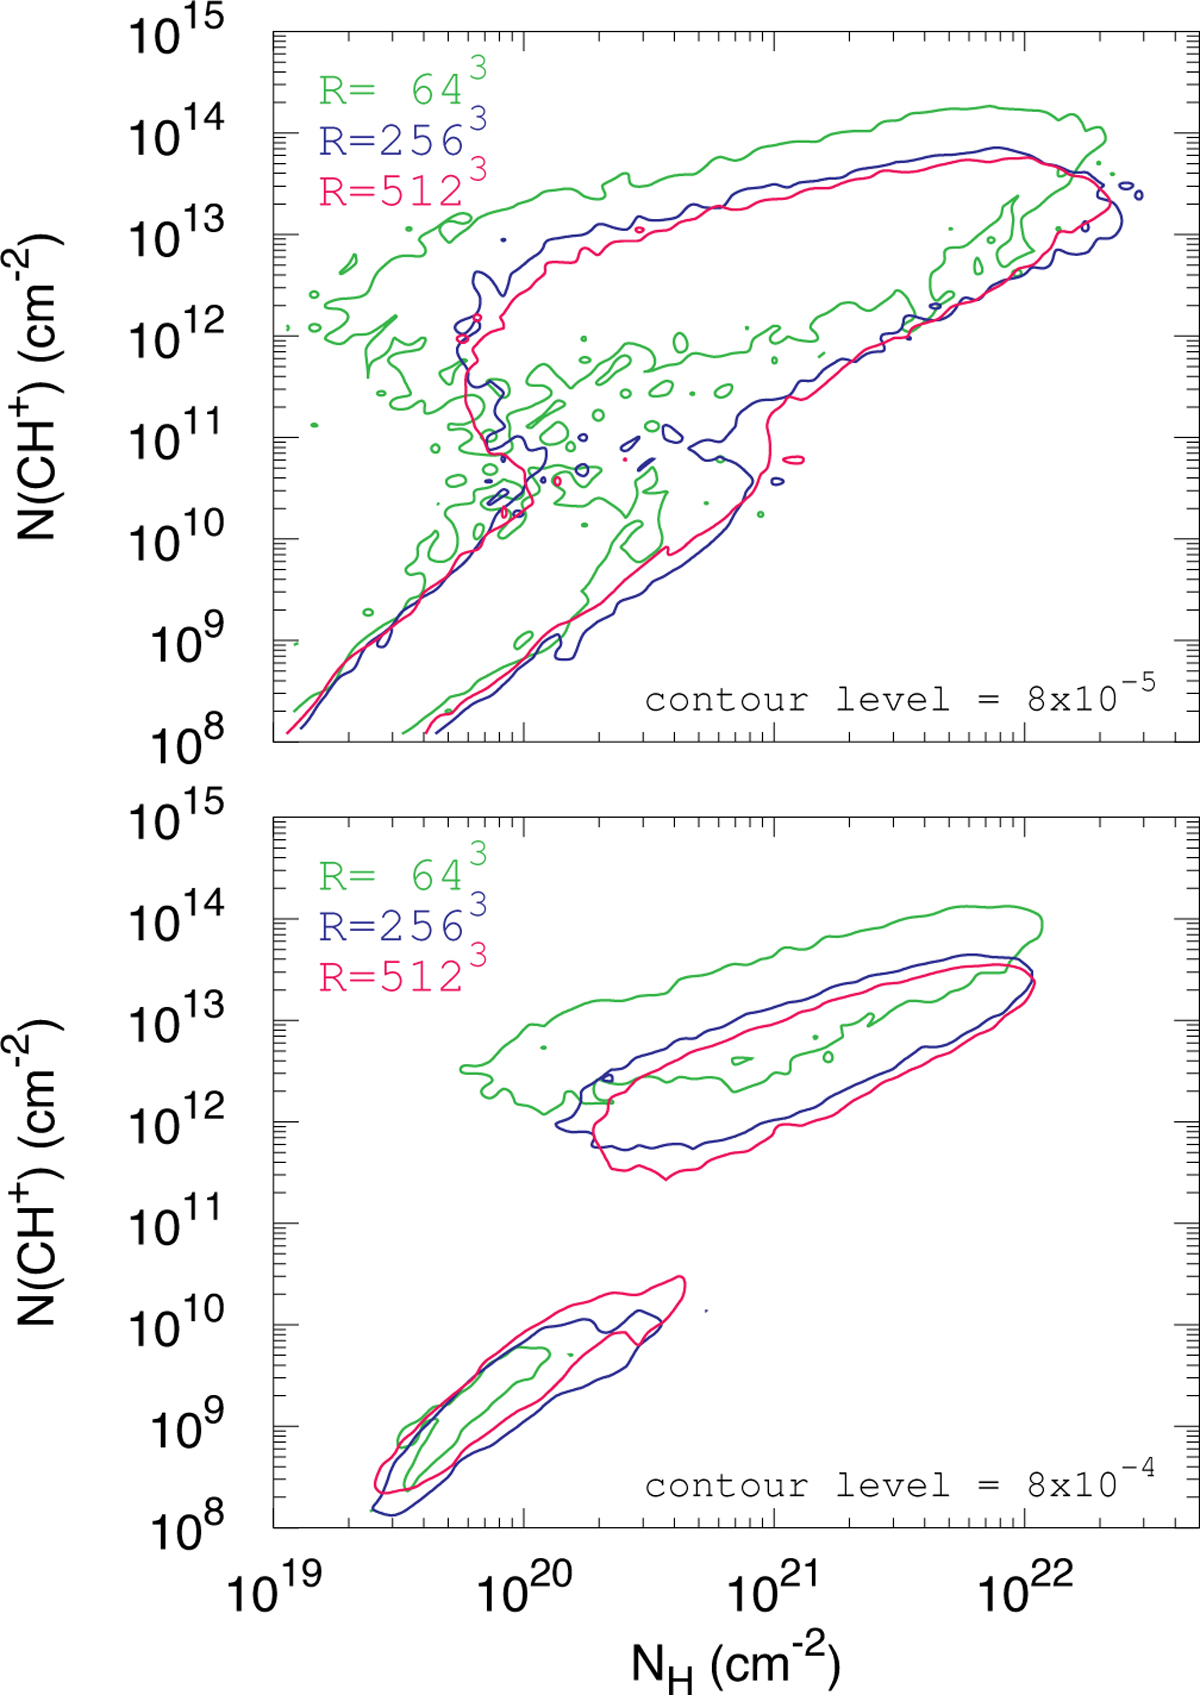
Fig. 9
Download original image
Isocontours of the 2D probability histograms of NH and N(CH+) predicted by simulations with a resolution R = 643 (green curve), 2563 (blue curve), and 5123 (pink curve), after application of the chemical solver and the lines of sight reconstruction algorithm. This representation shows, in a simplified manner, the effect of the resolution on the result displayed in Fig. 5. The isocontours chosen at 8 × 10⁻⁵ (top panel) and 8 × 10⁻⁴ (bottom panel) highlight the changes in the distribution of the most probable lines of sight. These values correspond to the turquoise blue and orange levels of the 2D probability histograms of NH and N(CH+) (see Fig. 5).
Current usage metrics show cumulative count of Article Views (full-text article views including HTML views, PDF and ePub downloads, according to the available data) and Abstracts Views on Vision4Press platform.
Data correspond to usage on the plateform after 2015. The current usage metrics is available 48-96 hours after online publication and is updated daily on week days.
Initial download of the metrics may take a while.