Fig. 8
Download original image
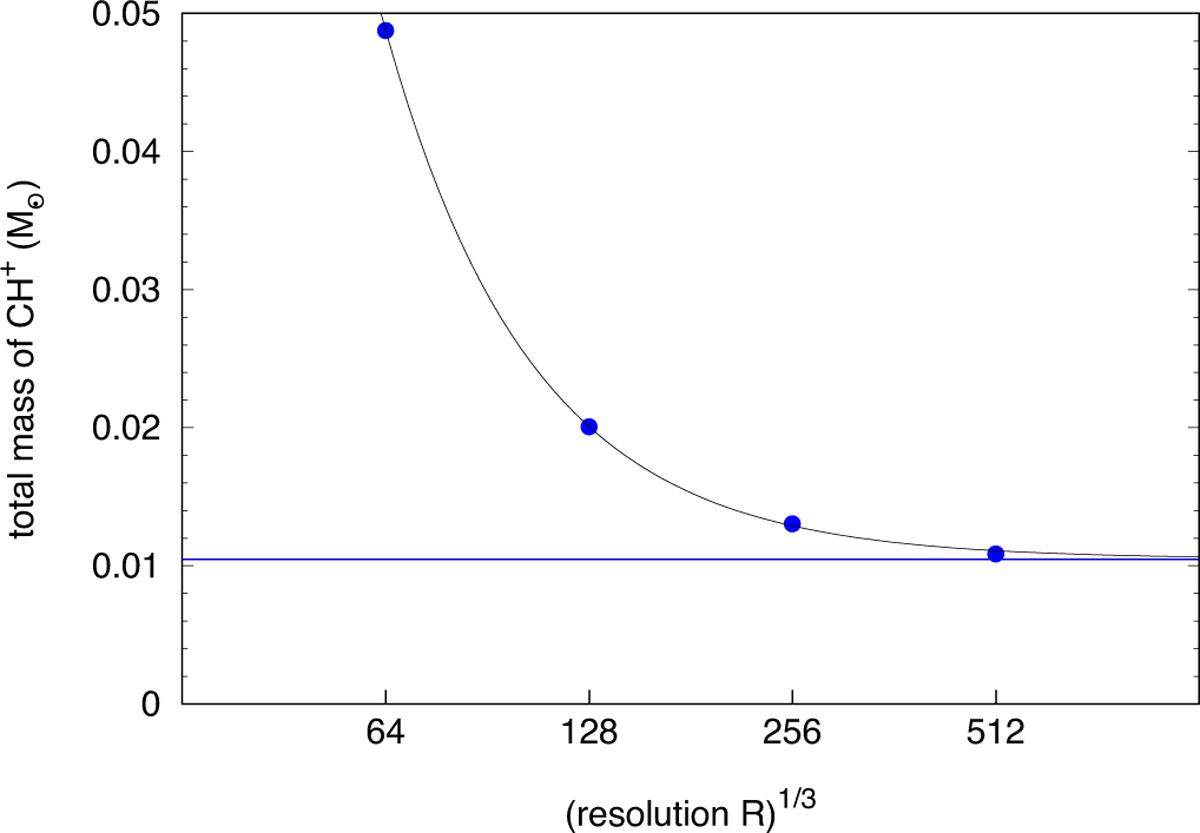
Total mass of CH+, Mtot(CH+), contained in simulations at different resolutions R (blue points). The data are fitted with the function a/Rb/3 + c, where a, b, and c are adjustable coefficients. The best fit (black curve) corresponds to the function 1.57 × 10²/R2/3 + 1.05 × 10⁻² and tends toward the constant value 1.05 × 10⁻² (blue line) at high resolution.
Current usage metrics show cumulative count of Article Views (full-text article views including HTML views, PDF and ePub downloads, according to the available data) and Abstracts Views on Vision4Press platform.
Data correspond to usage on the plateform after 2015. The current usage metrics is available 48-96 hours after online publication and is updated daily on week days.
Initial download of the metrics may take a while.