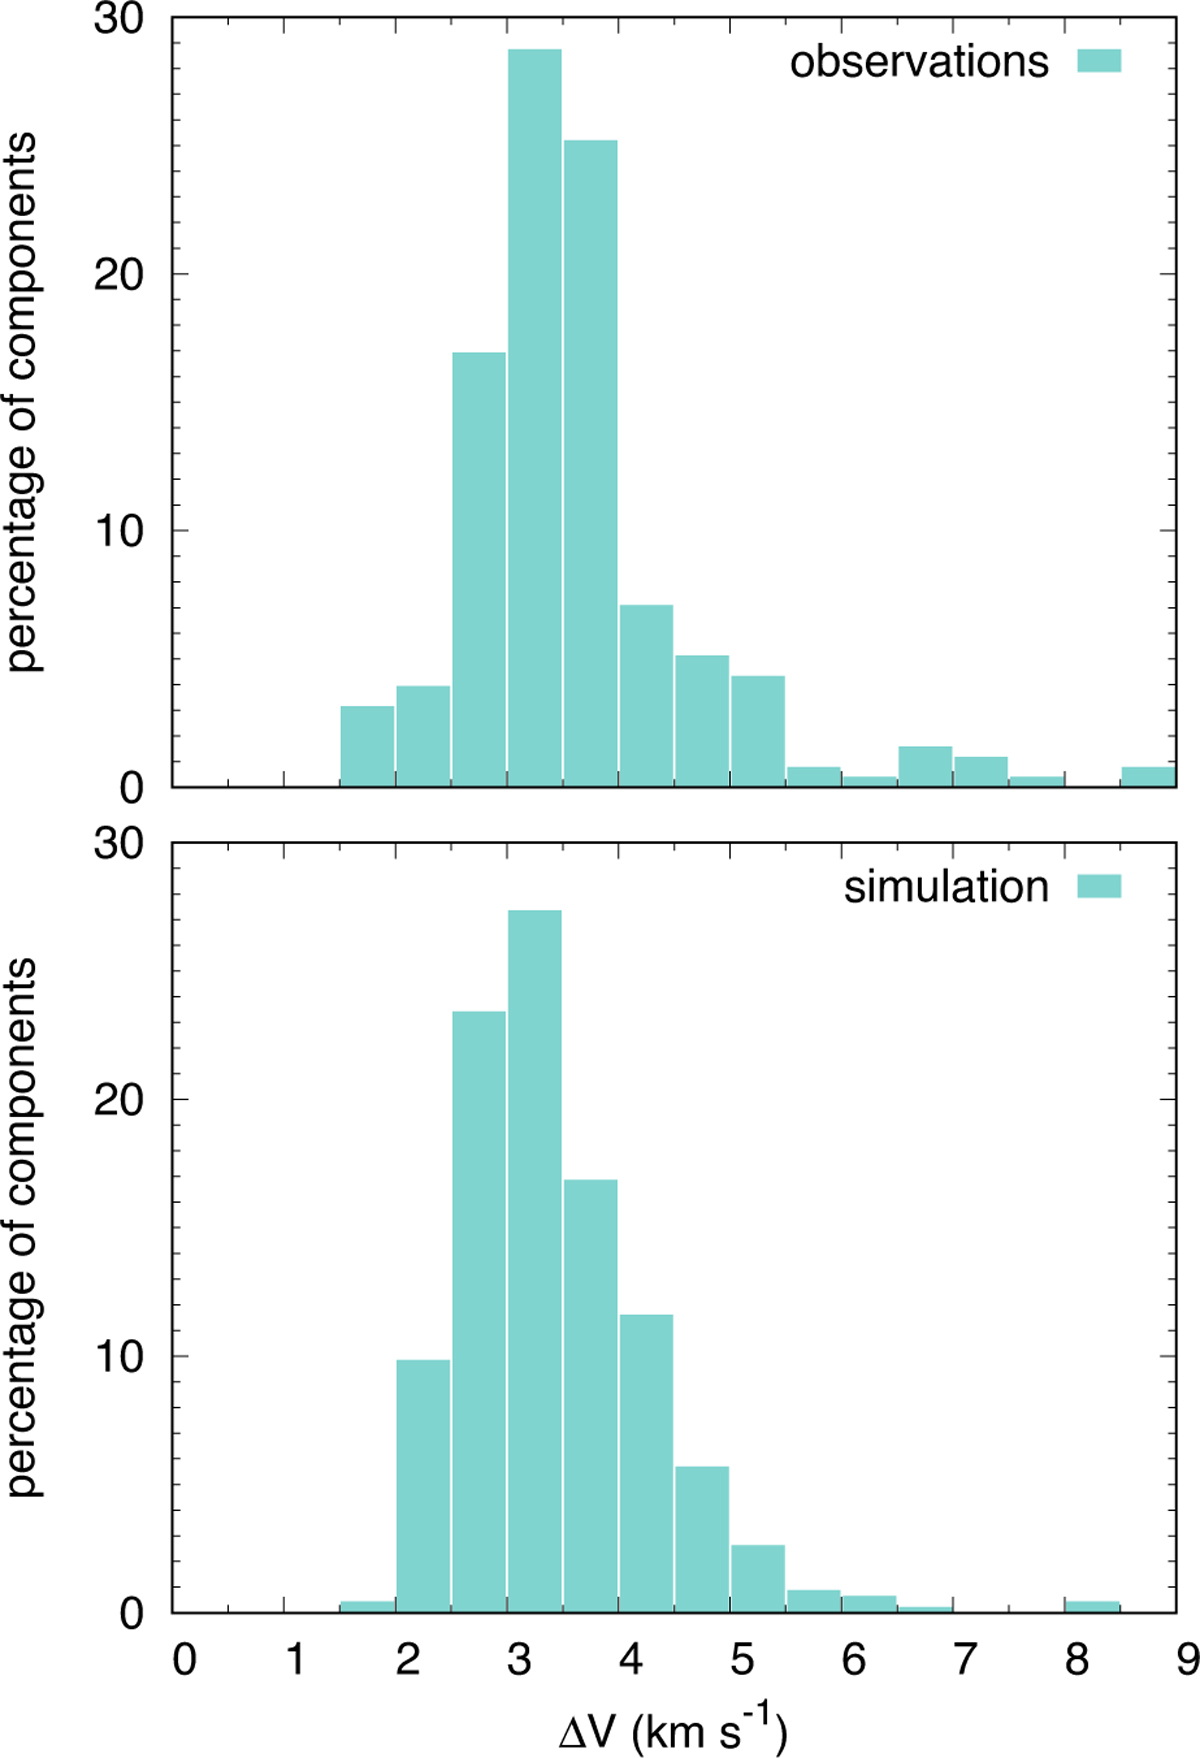
Fig. 7
Download original image
Probability distributions of the full width at half maximum ΔV of the 4232 A line of CH+ derived from the observations (top panel) and from synthetic spectra (see Fig. 6) computed across the standard simulation (bottom panel). The observational sample includes 254 velocity components extracted along 120 lines of sight by Federman (1982; Table 2), Lambert & Danks (1986; Table 1), Crane et al. (1995; Table 2), Pan et al. (2004; Table 4), Ritchey et al. (2006; Table 4), and Sheffer et al. (2008; Table 3). This dataset includes all the lines of sight where CH+ has been observed (see Table A.1), except those observed or compiled by Gredel et al. (2002) and Rachford et al. (2002), who do not provide measurements of the CH+ linewidth.
Current usage metrics show cumulative count of Article Views (full-text article views including HTML views, PDF and ePub downloads, according to the available data) and Abstracts Views on Vision4Press platform.
Data correspond to usage on the plateform after 2015. The current usage metrics is available 48-96 hours after online publication and is updated daily on week days.
Initial download of the metrics may take a while.