Fig. 6
Download original image
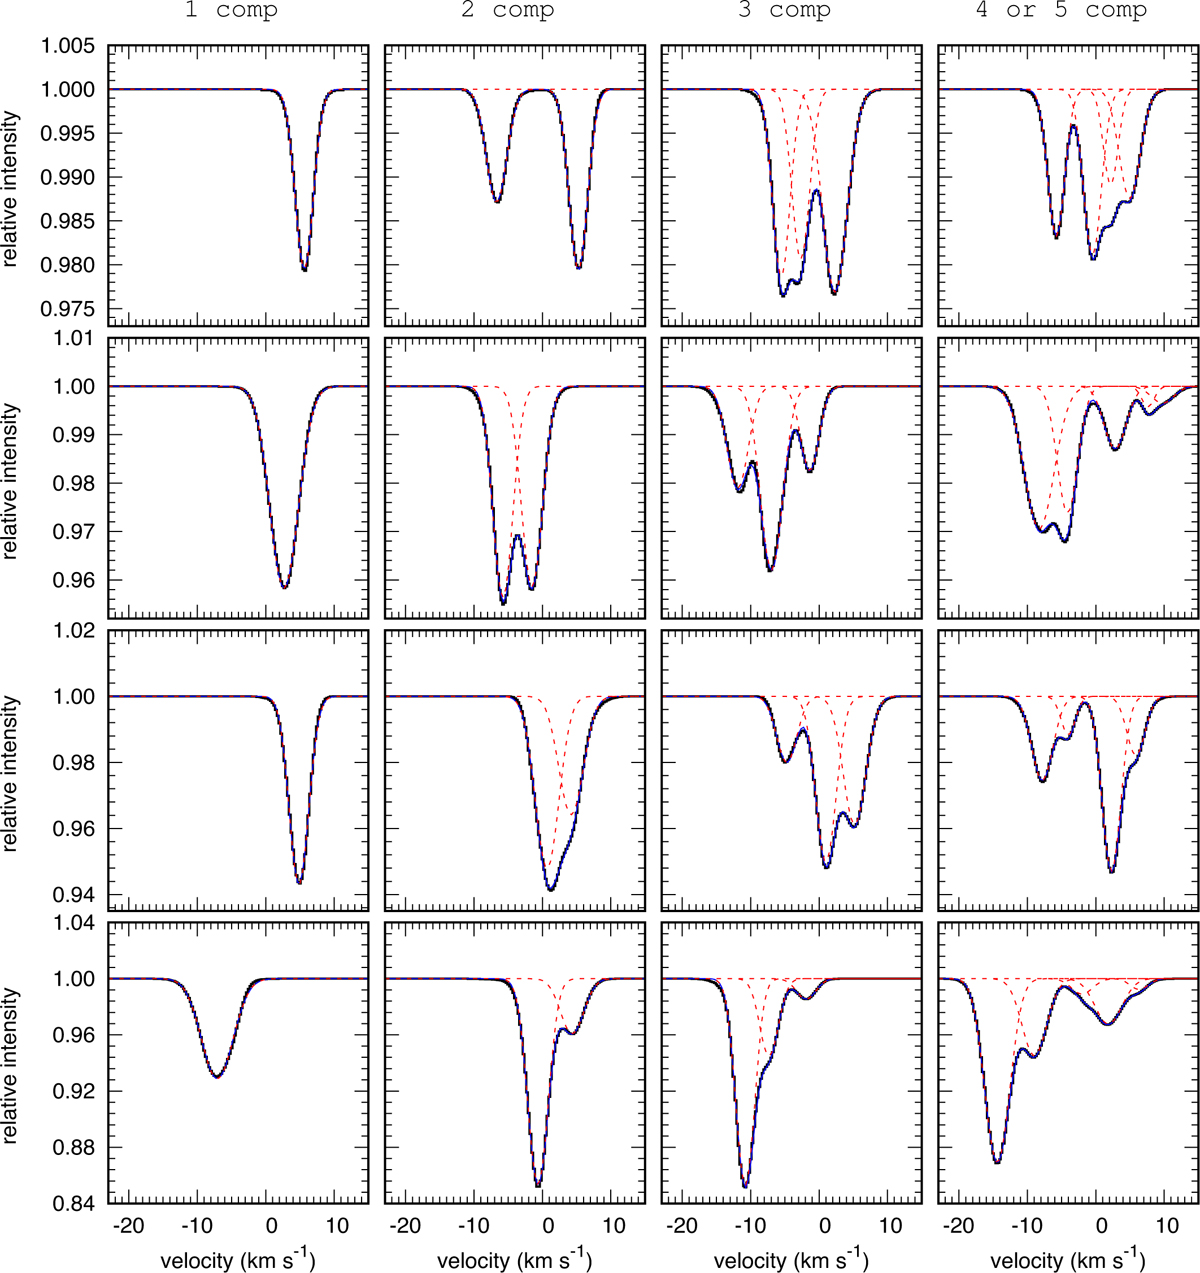
Examples of absorption profiles of the 4232 Å line of CH+ computed along the x-axis across the standard simulation (see Table 1). The black histograms are the computed spectra. The colored curves are the results of a multi-Gaussian fit applied to the line opacity and display the individual Gaussian components (dashed red curves) and their sum (solid blue curves). The spectra are classified in increasing order of their maximum opacity (from top to bottom) and in increasing order of the number of Gaussian components used in the fit (from left to right).
Current usage metrics show cumulative count of Article Views (full-text article views including HTML views, PDF and ePub downloads, according to the available data) and Abstracts Views on Vision4Press platform.
Data correspond to usage on the plateform after 2015. The current usage metrics is available 48-96 hours after online publication and is updated daily on week days.
Initial download of the metrics may take a while.