Fig. 5
Download original image
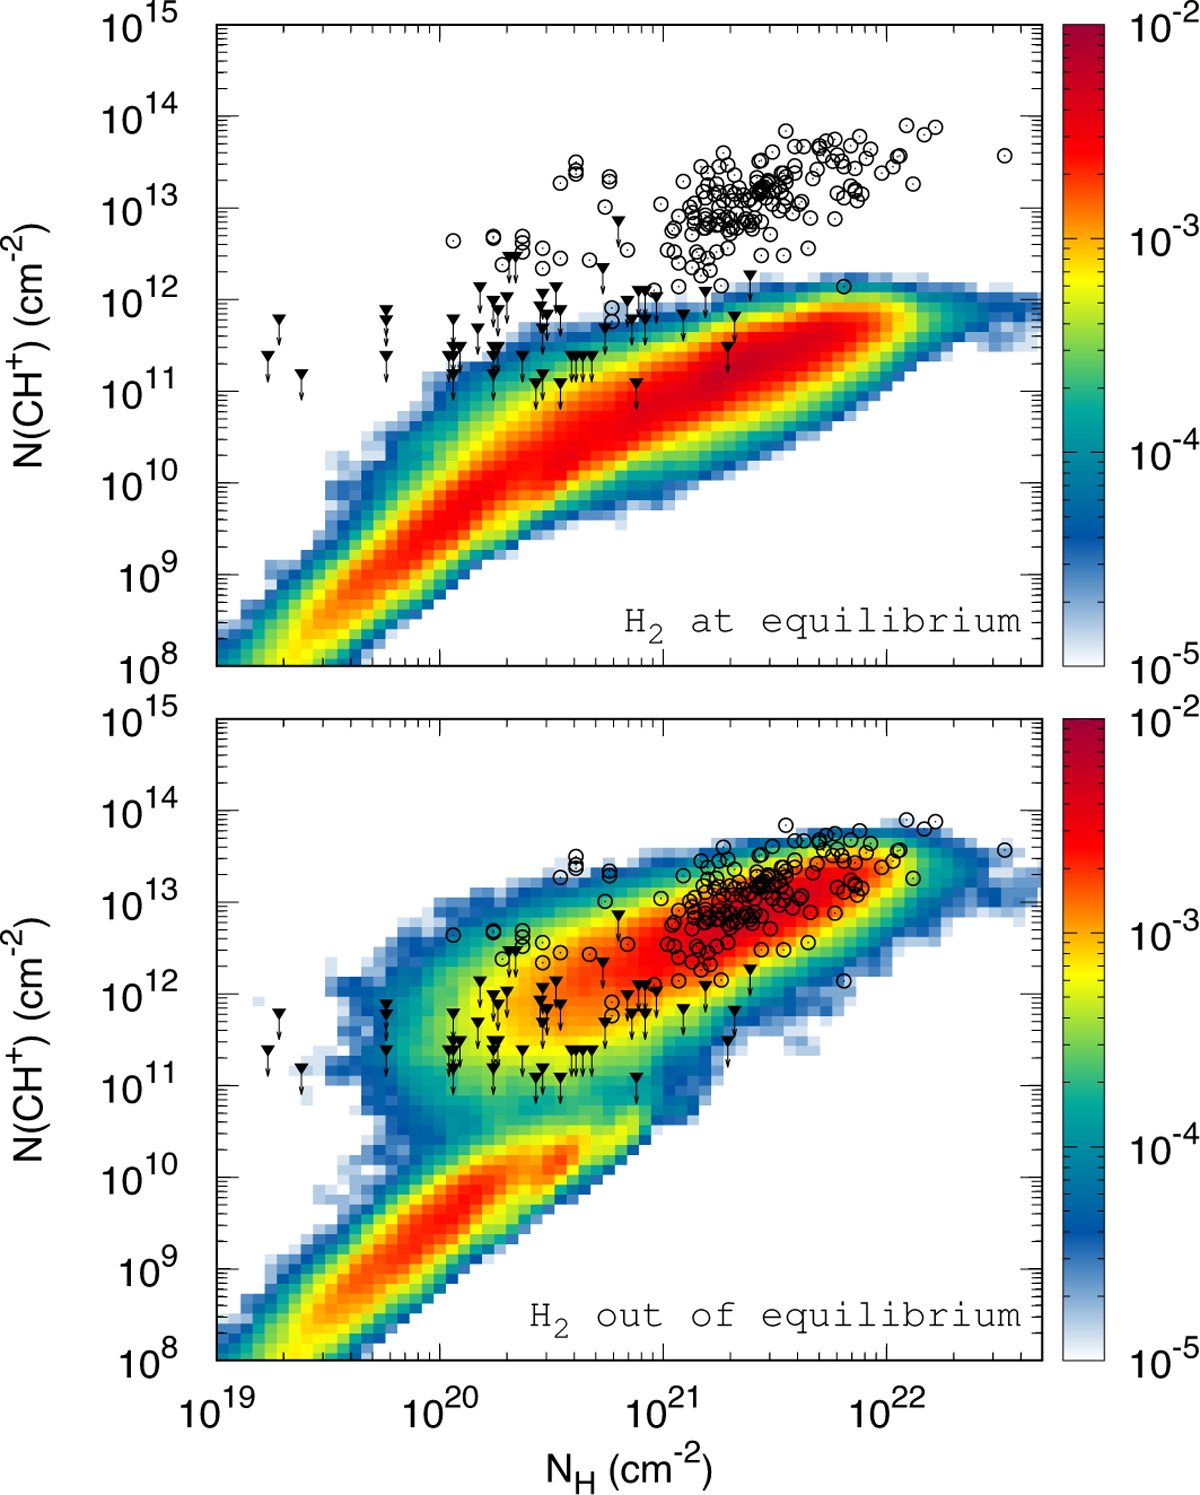
Comparison of the observational dataset (black points) with the 2D probability histogram of NH and N(CH+) predicted by the fiducial simulation (colored histogram) after application of the chemical solver and the lines of sight reconstruction algorithm. The observational dataset include detections (open circles) and nondetections (filled triangles) of CH+. The color-coding indicates the fraction of lines of sight (in logarithmic scale) contained in each bin. Two cases are shown: the chemical solver computes the abundance of H2 at equilibrium (top panel) or uses the out-of-equilibrium abundance of H2 calculated during the simulation (bottom panel).
Current usage metrics show cumulative count of Article Views (full-text article views including HTML views, PDF and ePub downloads, according to the available data) and Abstracts Views on Vision4Press platform.
Data correspond to usage on the plateform after 2015. The current usage metrics is available 48-96 hours after online publication and is updated daily on week days.
Initial download of the metrics may take a while.