Open Access
Fig. 4
Download original image
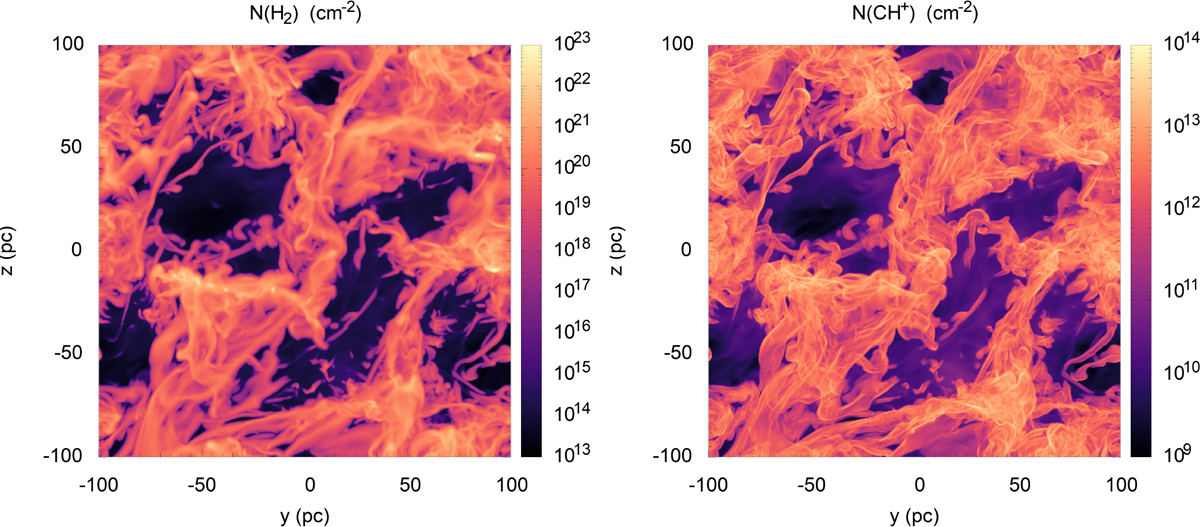
Maps of the column densities of H2 (left panel) and CH+ (right panel) predicted with the standard simulation (see Table 1) and obtained by integrating the densities along the x-axis over the entire box of size L = 200 pc.
Current usage metrics show cumulative count of Article Views (full-text article views including HTML views, PDF and ePub downloads, according to the available data) and Abstracts Views on Vision4Press platform.
Data correspond to usage on the plateform after 2015. The current usage metrics is available 48-96 hours after online publication and is updated daily on week days.
Initial download of the metrics may take a while.