Fig. 3
Download original image
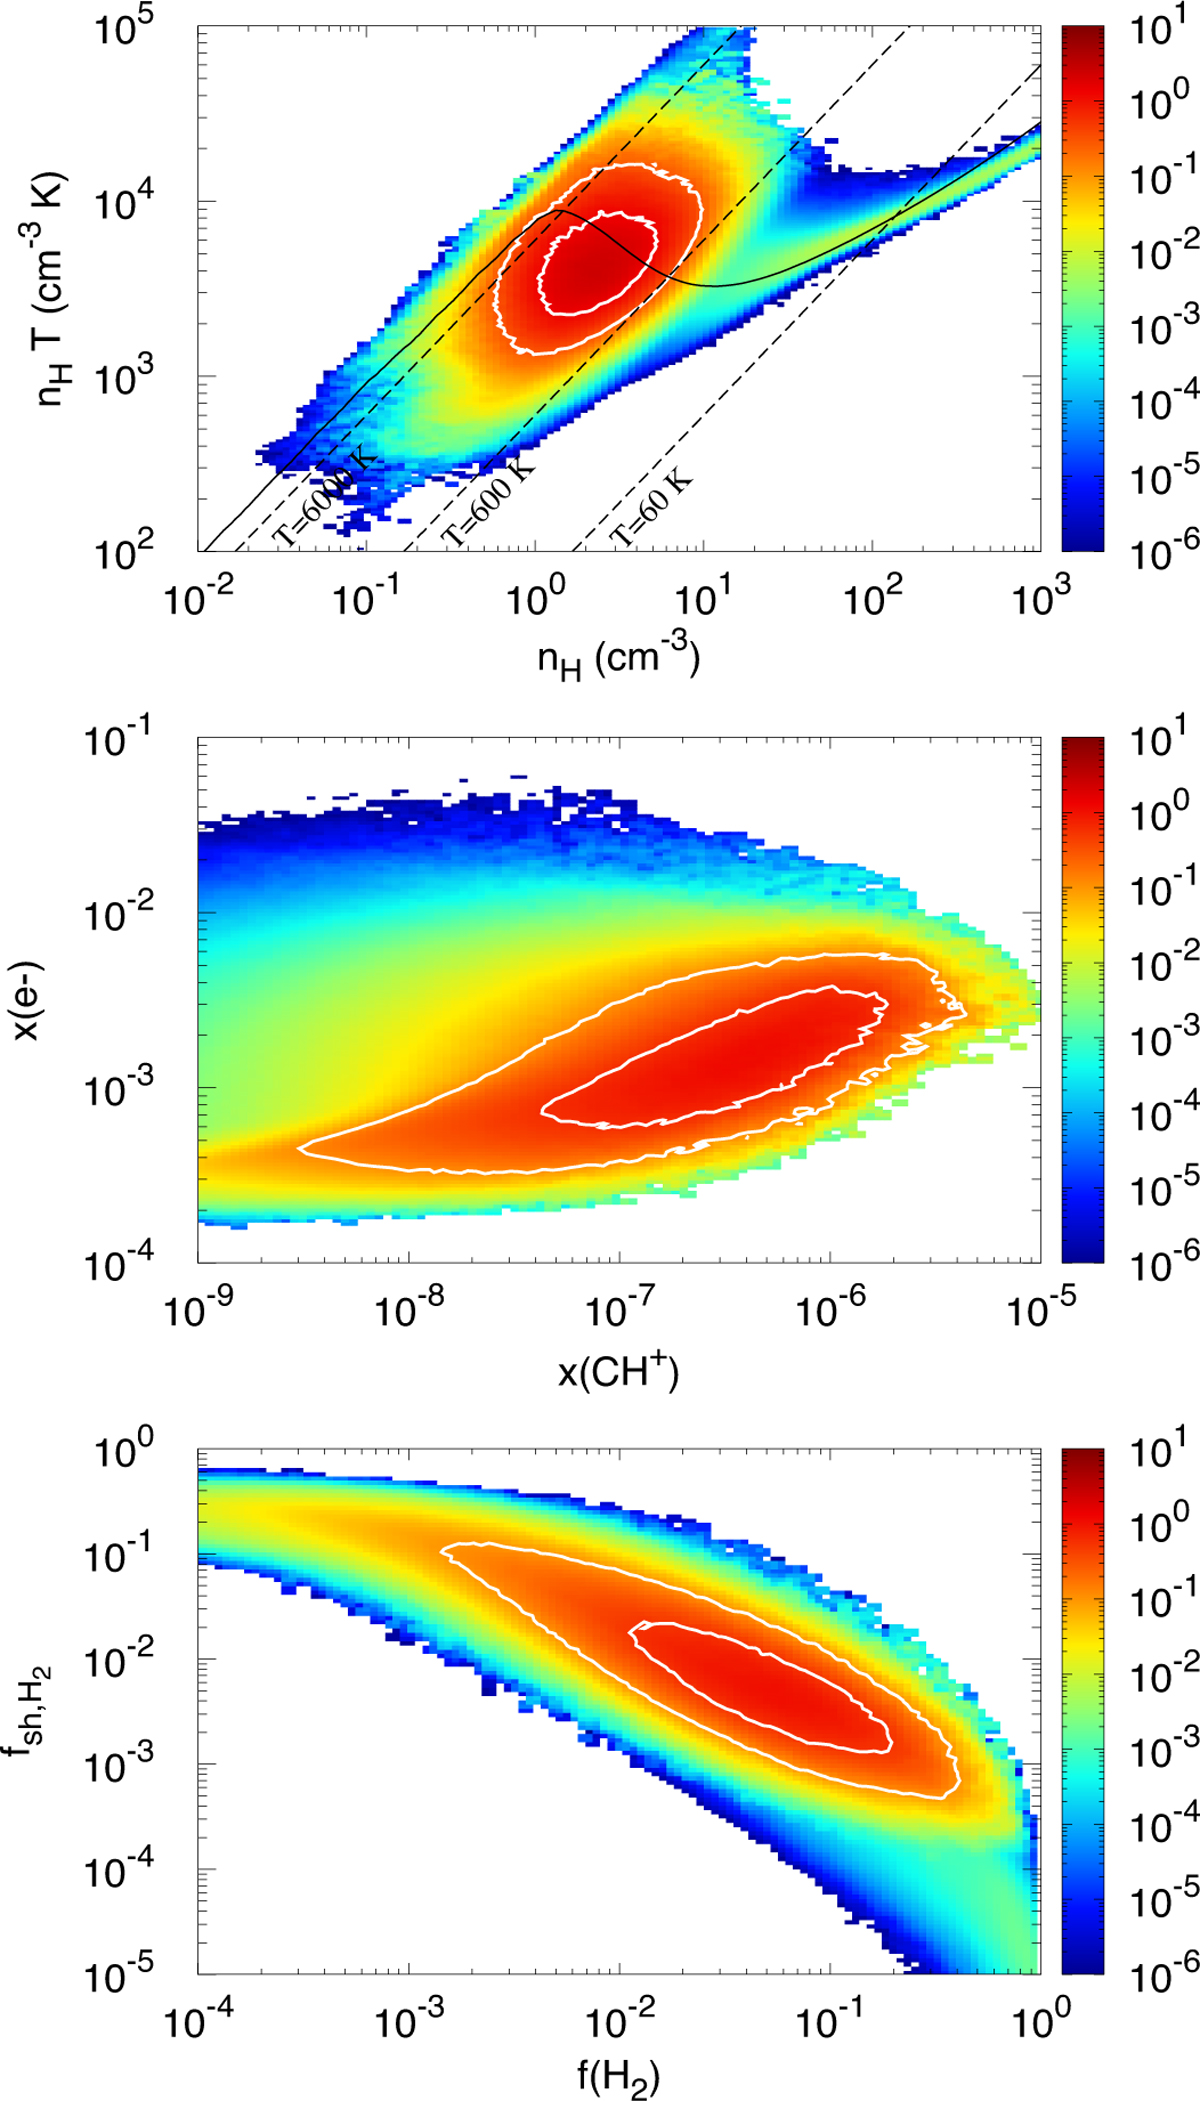
Two-dimensional probability distribution functions of the fraction of mass of CH+ in the fiducial simulation d[M(CH+)/Mtot(CH+)]/[dlog(a) dlog(b)] displayed in a a = nH and b = nHT diagram (top panel), a a = x(CH+) and b = x(e−) diagram (middle panel), and a a = f(H2) and ![]() diagram (bottom panel). The black solid curve in the top panel indicates the thermal equilibrium state expected for a gas illuminated by the Mathis interstellar radiation field and located at a visual extinction of 0.2 magnitude, which roughly corresponds to the visual extinction at the center of the standard simulation. The black dashed lines are isothermal contours at T = 60, 600, and 6000 K. The white contours in all panels show the isocontours that encompass 50% and 90% of the total mass of CH+, Mtot(CH+).
diagram (bottom panel). The black solid curve in the top panel indicates the thermal equilibrium state expected for a gas illuminated by the Mathis interstellar radiation field and located at a visual extinction of 0.2 magnitude, which roughly corresponds to the visual extinction at the center of the standard simulation. The black dashed lines are isothermal contours at T = 60, 600, and 6000 K. The white contours in all panels show the isocontours that encompass 50% and 90% of the total mass of CH+, Mtot(CH+).
Current usage metrics show cumulative count of Article Views (full-text article views including HTML views, PDF and ePub downloads, according to the available data) and Abstracts Views on Vision4Press platform.
Data correspond to usage on the plateform after 2015. The current usage metrics is available 48-96 hours after online publication and is updated daily on week days.
Initial download of the metrics may take a while.