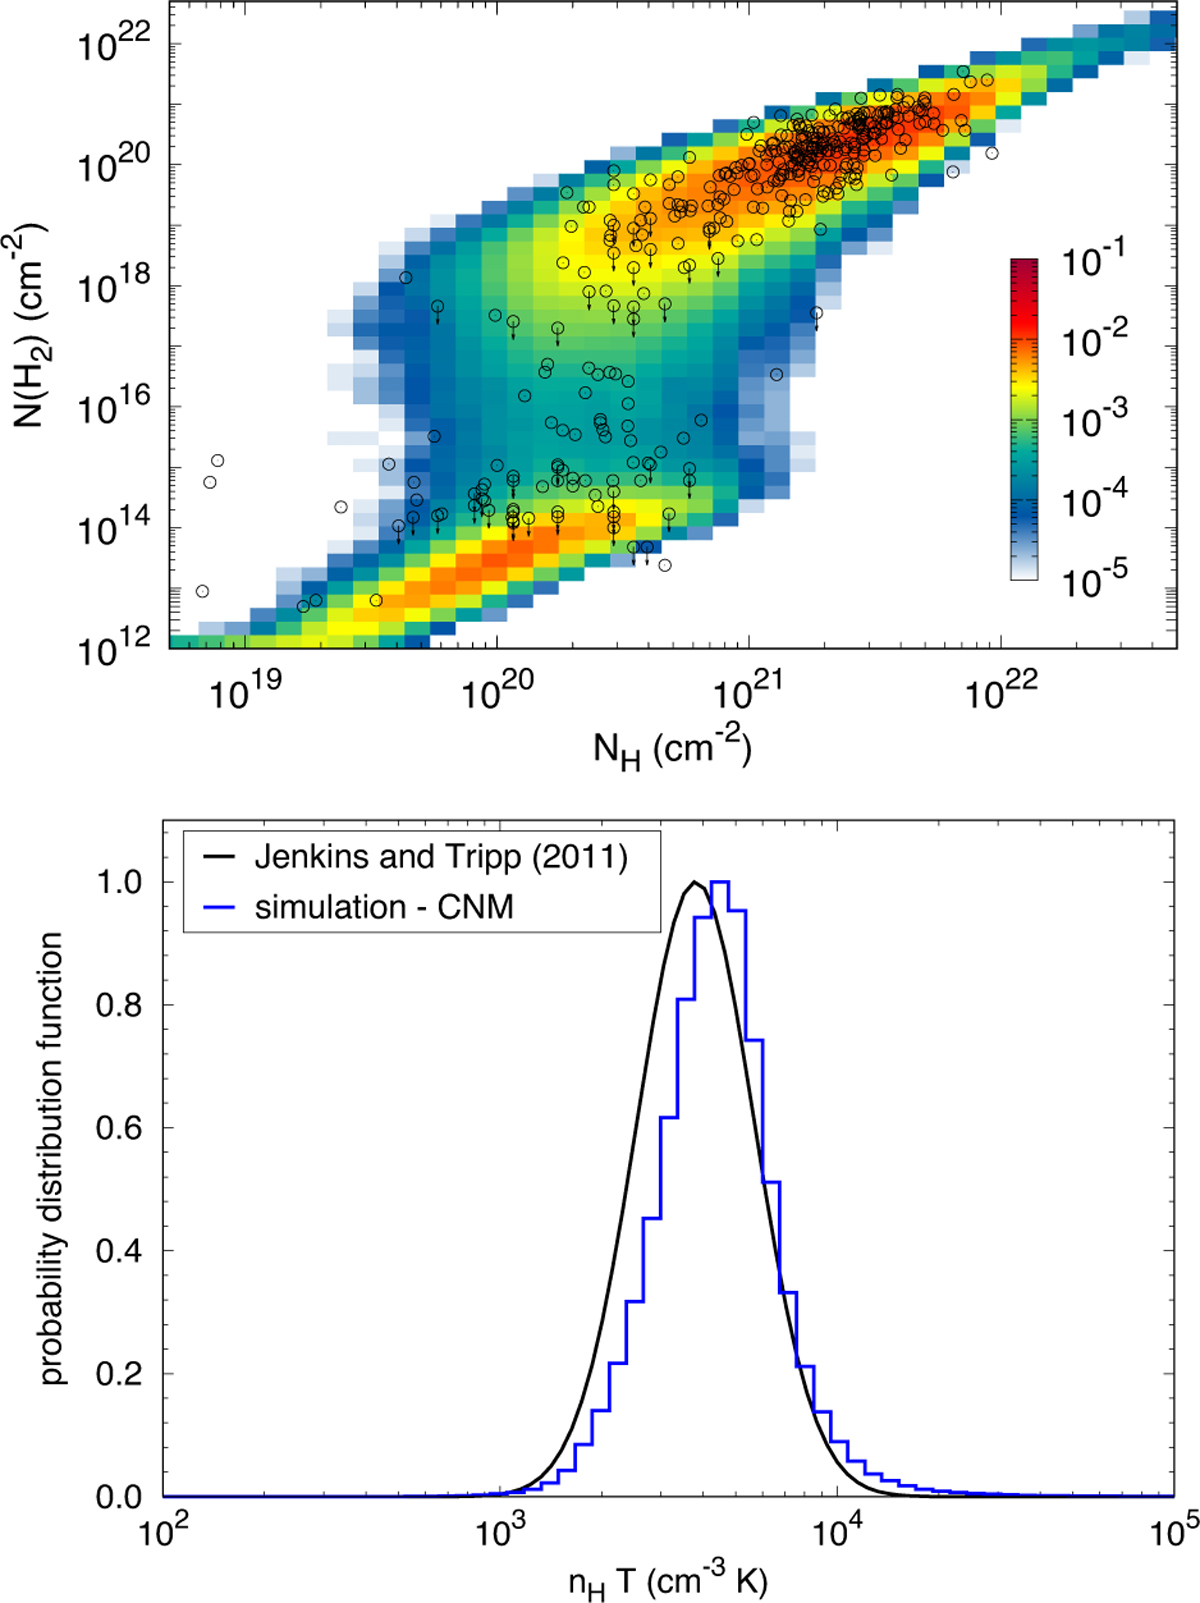
Fig. 2
Download original image
Comparison of the main thermochemical properties of the standard simulation with observations of the local diffuse ISM. Top: comparison of the observational dataset of the HI-to-H2 transition of Paper I (black points) to the 2D probability histogram obtained with the standard simulation after application of the reconstruction algorithm (see Sect. 3.8 of Paper I). Observations include detections of H2 (circles) and upper limits on its column density (arrows). The color-coding indicates the fraction of lines of sight (in logarithmic scale) contained in each bin. Bottom: probability distribution function of the thermal pressure of the cold neutral medium in the standard simulation (blue histograms) compared with the probability distribution function of the thermal pressure deduced from the observation of the fine structure levels of carbon (Jenkins & Tripp 2011; black curve). Both distributions are normalized to their maximum value to facilitate comparison.
Current usage metrics show cumulative count of Article Views (full-text article views including HTML views, PDF and ePub downloads, according to the available data) and Abstracts Views on Vision4Press platform.
Data correspond to usage on the plateform after 2015. The current usage metrics is available 48-96 hours after online publication and is updated daily on week days.
Initial download of the metrics may take a while.