Fig. 10
Download original image
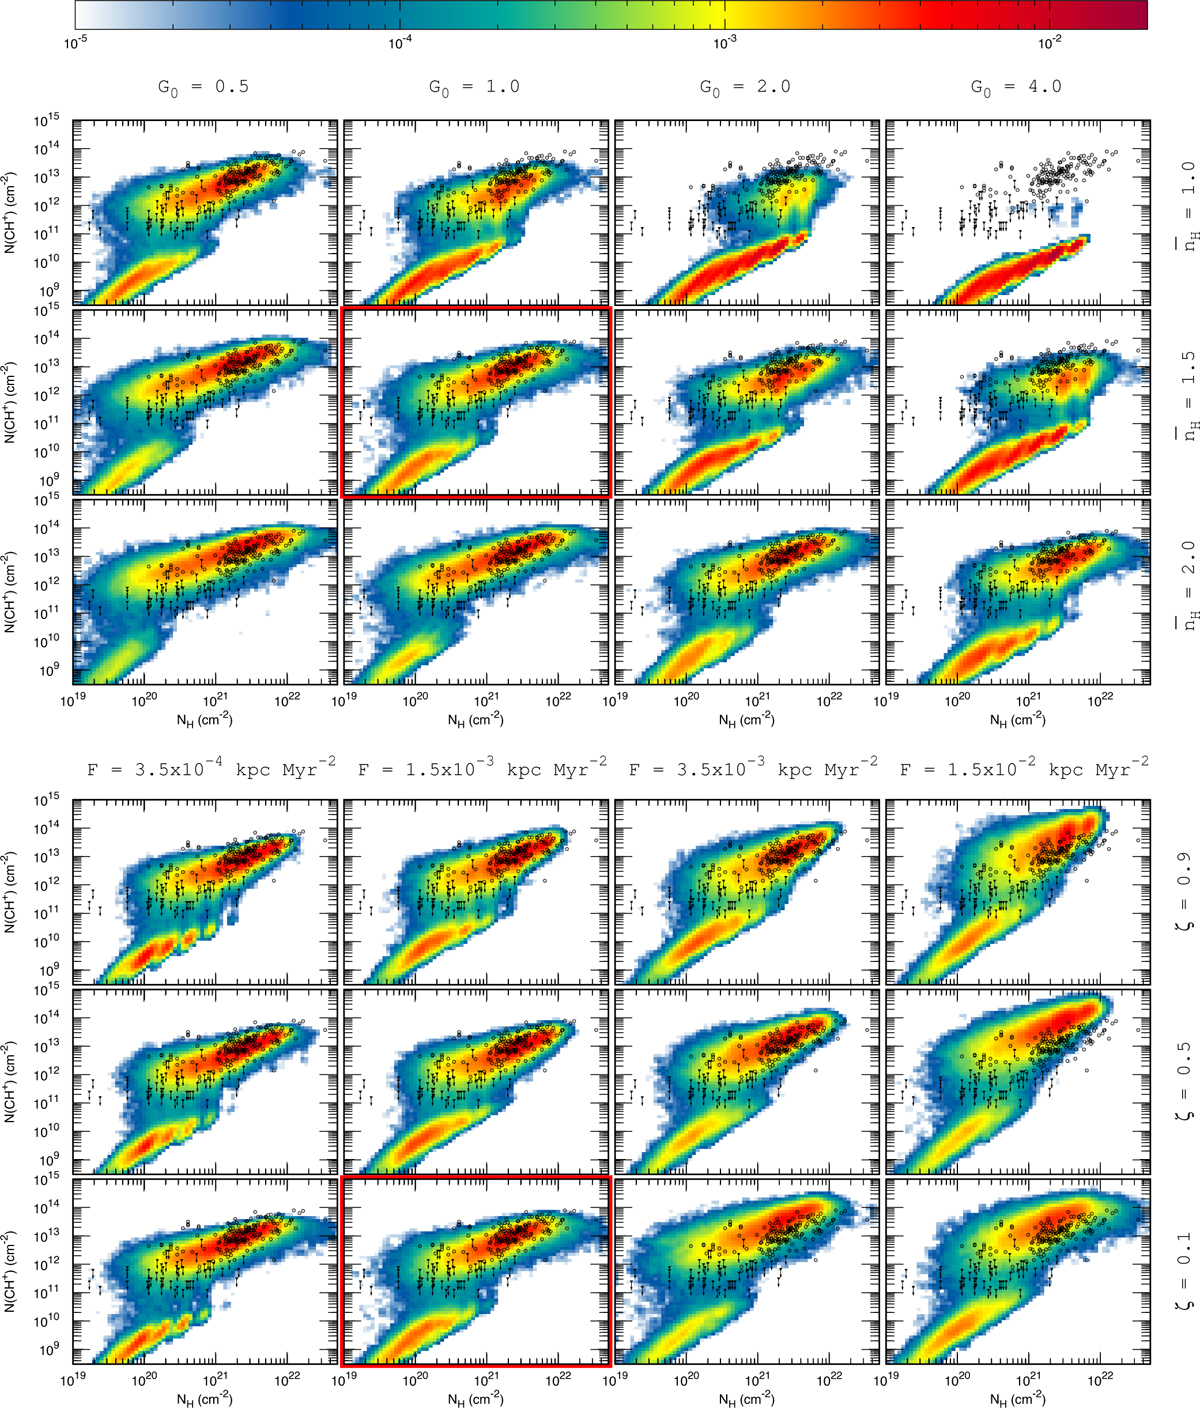
Comparison of the observational dataset (black points) with the 2D probability histograms of NH and N(CH+) predicted by numerical simulations (colored histograms) after application of the chemical solver and the lines of sight reconstruction algorithm. The observational dataset include detections (open circles) and nondetections (filled triangles) of CH+. Each panel in the top frame shows the prediction of a different simulation with G0 varying between 0.5 and 4 (from left to right) and ![]() varying between 1 and 2 cm−3 (from top to bottom). Each panel in the bottom frame shows the prediction of a different simulation with F varying between 3.5 × 10⁻⁴ and 1.5 × 10⁻² kpc Myr−2 (from left to right) and ζ varying between 0.9 and 0.1 (from top to bottom). If not indicated otherwise, all the other parameters are set to their fiducial values (see Table 1) except for the resolution, which is set here to R = 2563. The color-coding indicates the fraction of lines of sight (in logarithmic scale) contained in each bin. The simulation corresponding to the standard set of parameters (except for the resolution) is highlighted with a red square.
varying between 1 and 2 cm−3 (from top to bottom). Each panel in the bottom frame shows the prediction of a different simulation with F varying between 3.5 × 10⁻⁴ and 1.5 × 10⁻² kpc Myr−2 (from left to right) and ζ varying between 0.9 and 0.1 (from top to bottom). If not indicated otherwise, all the other parameters are set to their fiducial values (see Table 1) except for the resolution, which is set here to R = 2563. The color-coding indicates the fraction of lines of sight (in logarithmic scale) contained in each bin. The simulation corresponding to the standard set of parameters (except for the resolution) is highlighted with a red square.
Current usage metrics show cumulative count of Article Views (full-text article views including HTML views, PDF and ePub downloads, according to the available data) and Abstracts Views on Vision4Press platform.
Data correspond to usage on the plateform after 2015. The current usage metrics is available 48-96 hours after online publication and is updated daily on week days.
Initial download of the metrics may take a while.