Fig. 1
Download original image
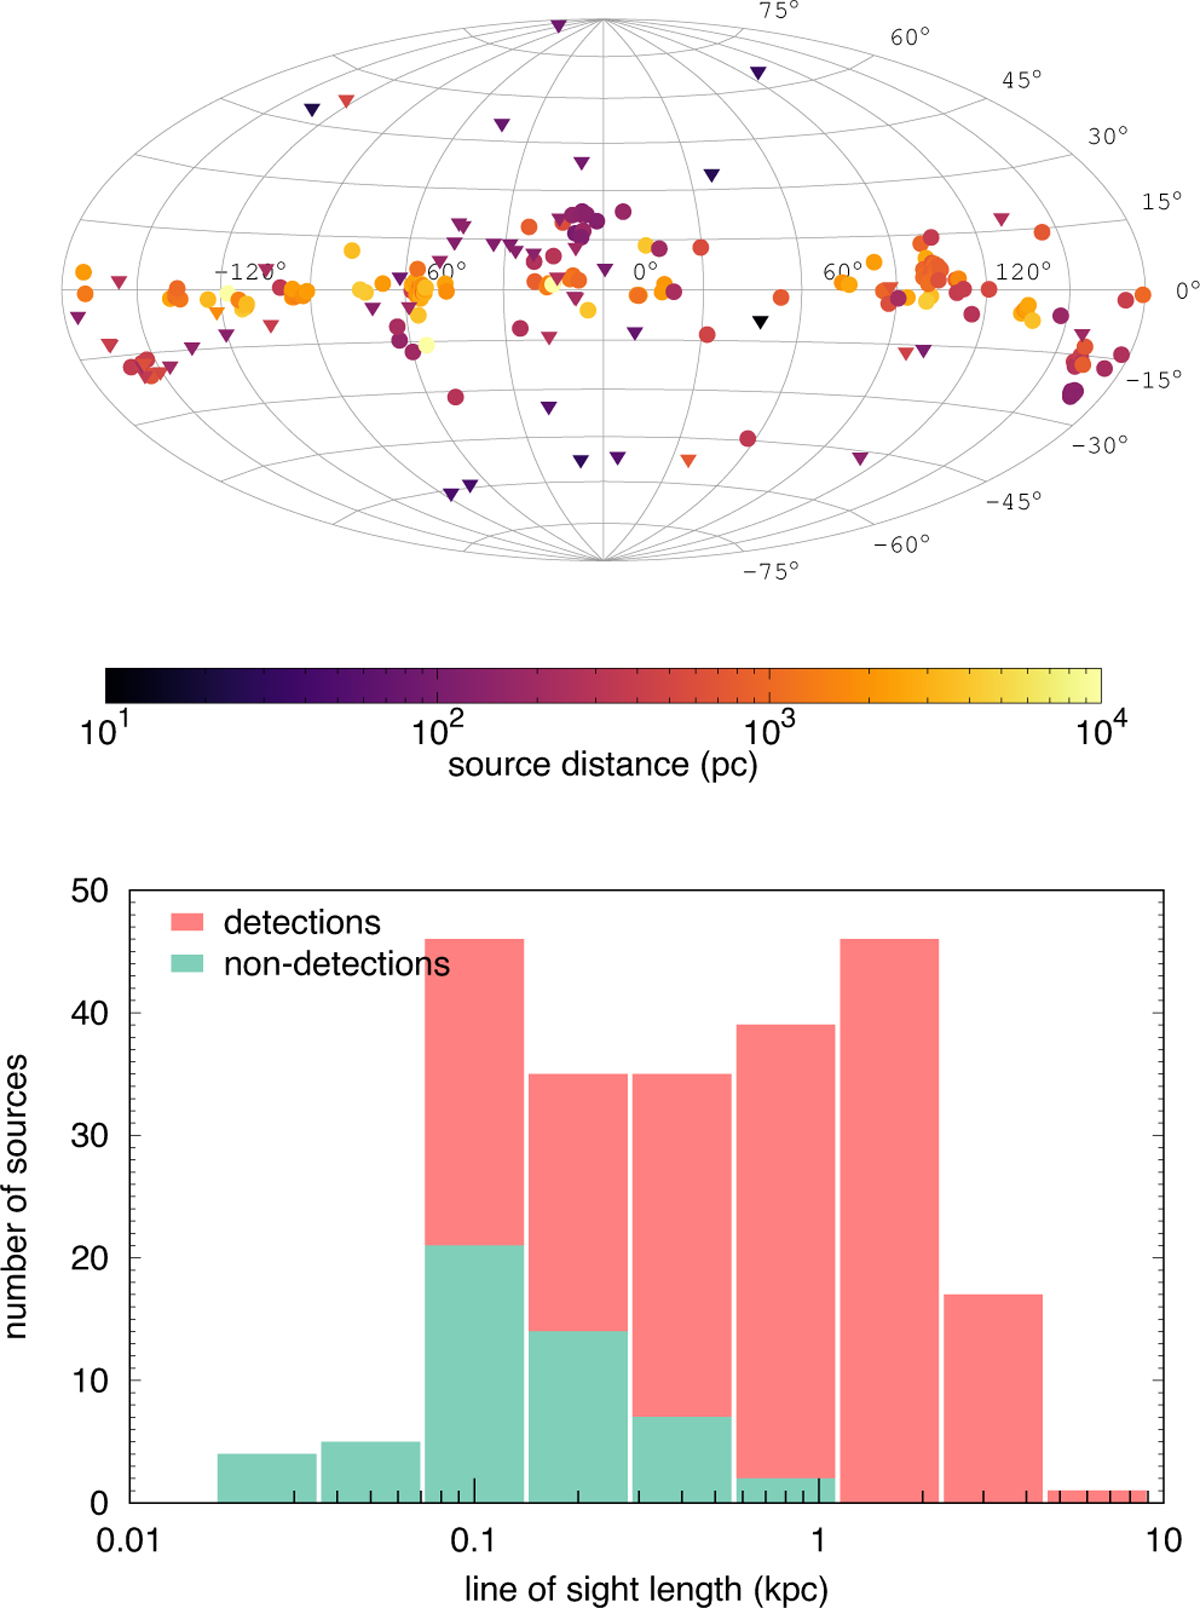
Properties of the observed lines of sight. Top: Aitoff projection, in Galactic longitude and latitude coordinates, of the background sources of the CH+ observational sample (see Table A.1). The color-coding indicates the distance of background sources, and the symbol shapes correspond to the lines of sight where CH+ is detected (circles) or not detected (triangles). Bottom: distribution of the lengths of the intercepted diffuse material computed with Eq. (1) along all the lines of sight of the observational sample. The orange sample corresponds to lines of sight where CH+ is detected and the green sample to those for which an upper limit on N(CH+) has been derived (see the bottom part of Table A.1). The two samples are summed in order to display the total number of sources observed in each bin.
Current usage metrics show cumulative count of Article Views (full-text article views including HTML views, PDF and ePub downloads, according to the available data) and Abstracts Views on Vision4Press platform.
Data correspond to usage on the plateform after 2015. The current usage metrics is available 48-96 hours after online publication and is updated daily on week days.
Initial download of the metrics may take a while.