Fig. 9.
Download original image
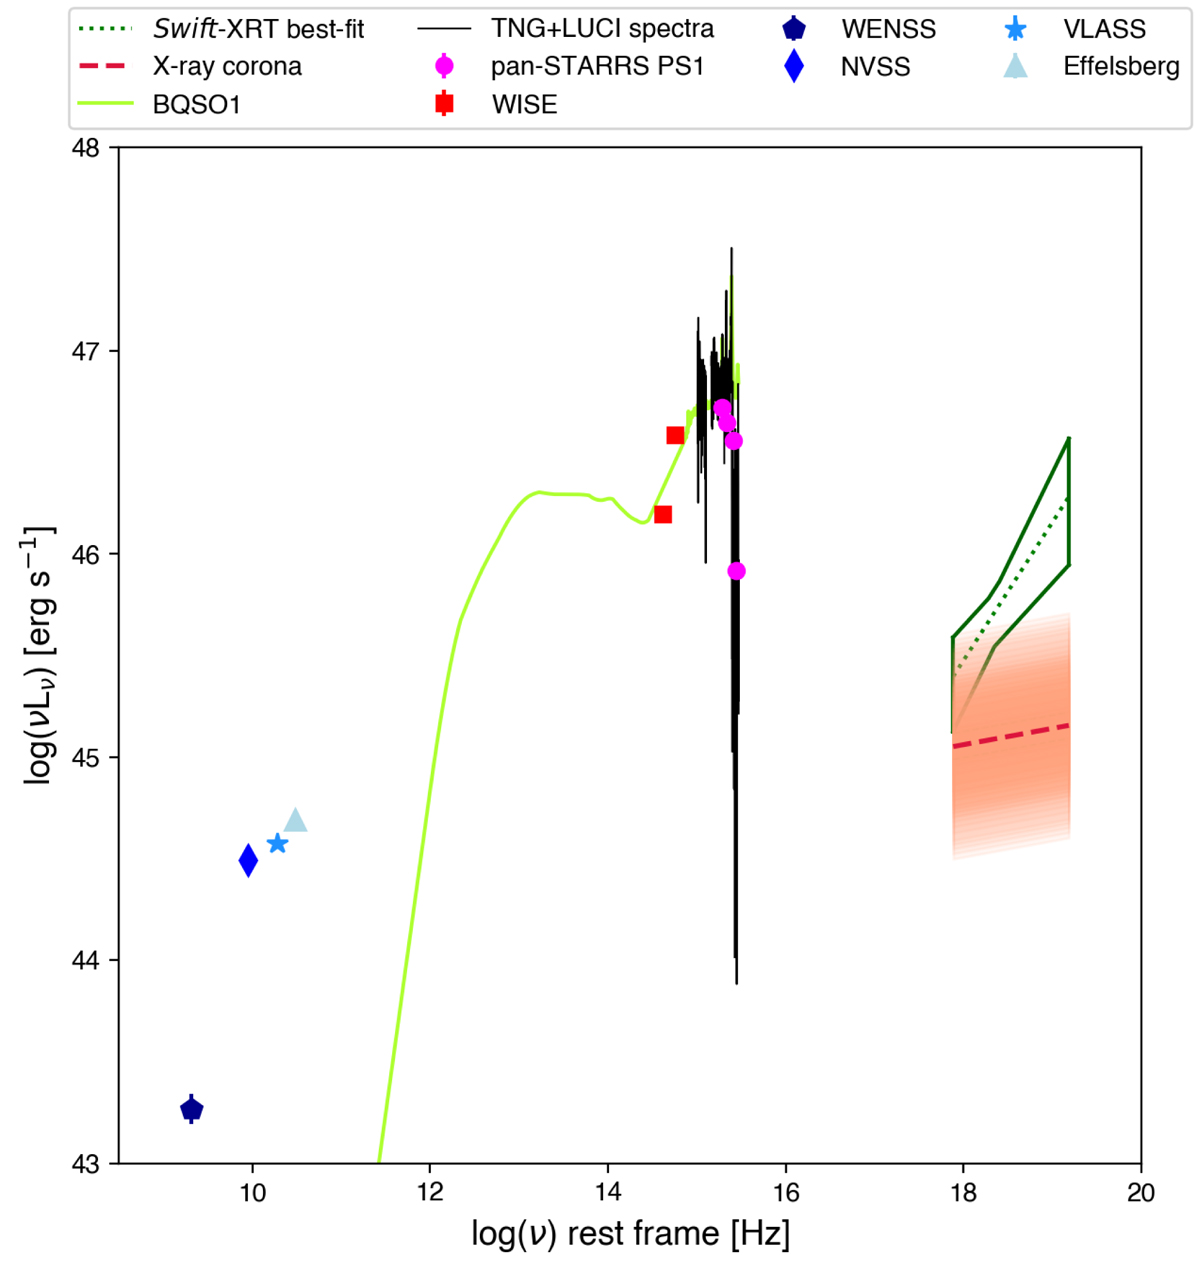
Rest-frame SED of PSO J191+86 from radio to X-ray frequencies. In the X-ray, we show the best-fit emission in the observed [0.5–10] keV energy band (green dotted line) with its uncertainty. We also report the TNG and LUCI spectra (in black) and a quasar template (SWIRE template library; light-green) as a guide line. The red dashed line represents the coronal emission expected from a RQ AGN with the same L2500 Å as PSO J191+86 according to the relation of Just et al. (2007), and the orange shaded area is the 1σ uncertainty on this estimate.
Current usage metrics show cumulative count of Article Views (full-text article views including HTML views, PDF and ePub downloads, according to the available data) and Abstracts Views on Vision4Press platform.
Data correspond to usage on the plateform after 2015. The current usage metrics is available 48-96 hours after online publication and is updated daily on week days.
Initial download of the metrics may take a while.